SIA Engineering: Consolidate in a Triangle
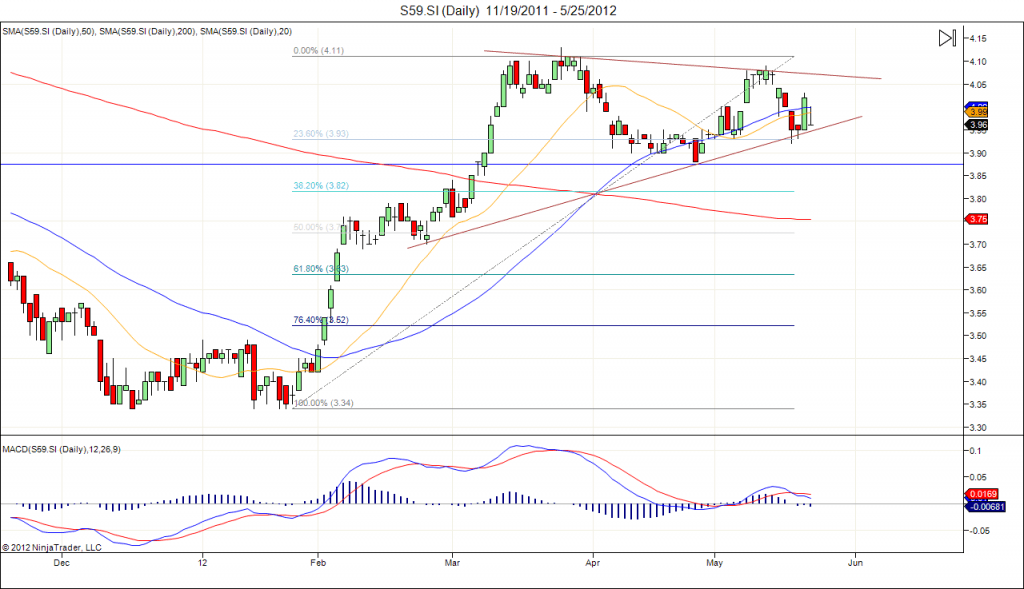
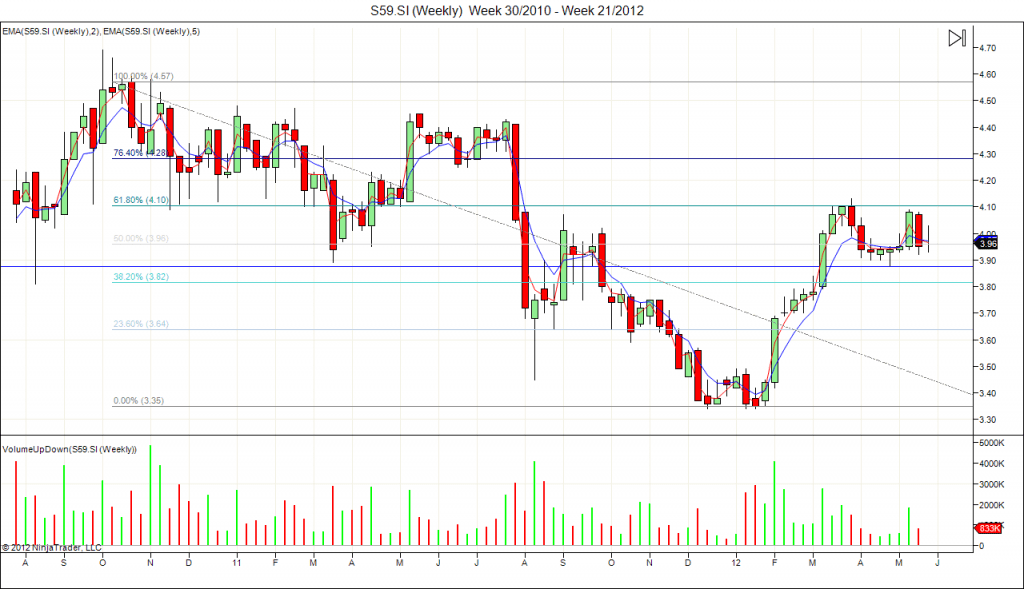
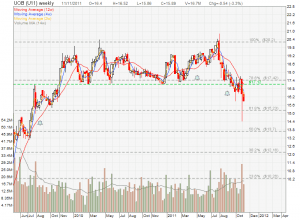
SIA Engineering is currently trading in a Triangle with no clear trend on daily chart. Weekly chart shows SIA Engineering is moving sideway. However, need to take note that SIA Engineering has been rejected twice at 61.8% Fibonacci Retracement Level on the weekly chart. Double Tops pattern can be seen on both daily and weekly chart.
- Current Price = $3.99
- Current PE = 16.28
- Rolling PE = 16.28
- Beta (75 days) = 0.17
- Dividend Yield = 5.23%
- XD Date = July 23, 2012
Things to watch out:
- Triangle support or Double Tops neckline is at about $3.90.
- Resistance at about $4.00 followed by $4.10.
- 2/5 EMA crossover and 20D SMA direction.
I am preparing for a bearish entry.

