Suntec REIT Fundamental & Technical Analysis

  • Post author:

Suntec REIT April 2017

Suntec REIT Fundamental Analysis

  • Last Done Price = $1.85
  • Market Cap = $4.7 B
  • NAV = $2.12
  • Price /  NAV = 0.87 (13% Discount)
  • Price /  NAV (High)= 0.97
  • Price /  NAV (Low) = 0.73
  • Distribution Yield (TTM) = 5.44%
  • Gearing Ratio = 37.7%
  • WALE (Retail) = 2.27 Years
  • WALE (Office) = 4.02 Years
  • WADM = 2.56 Years
  • Occupancy Rate (Retail)  = 98.0%
  • Occupancy Rate (Office)  = 98.9%
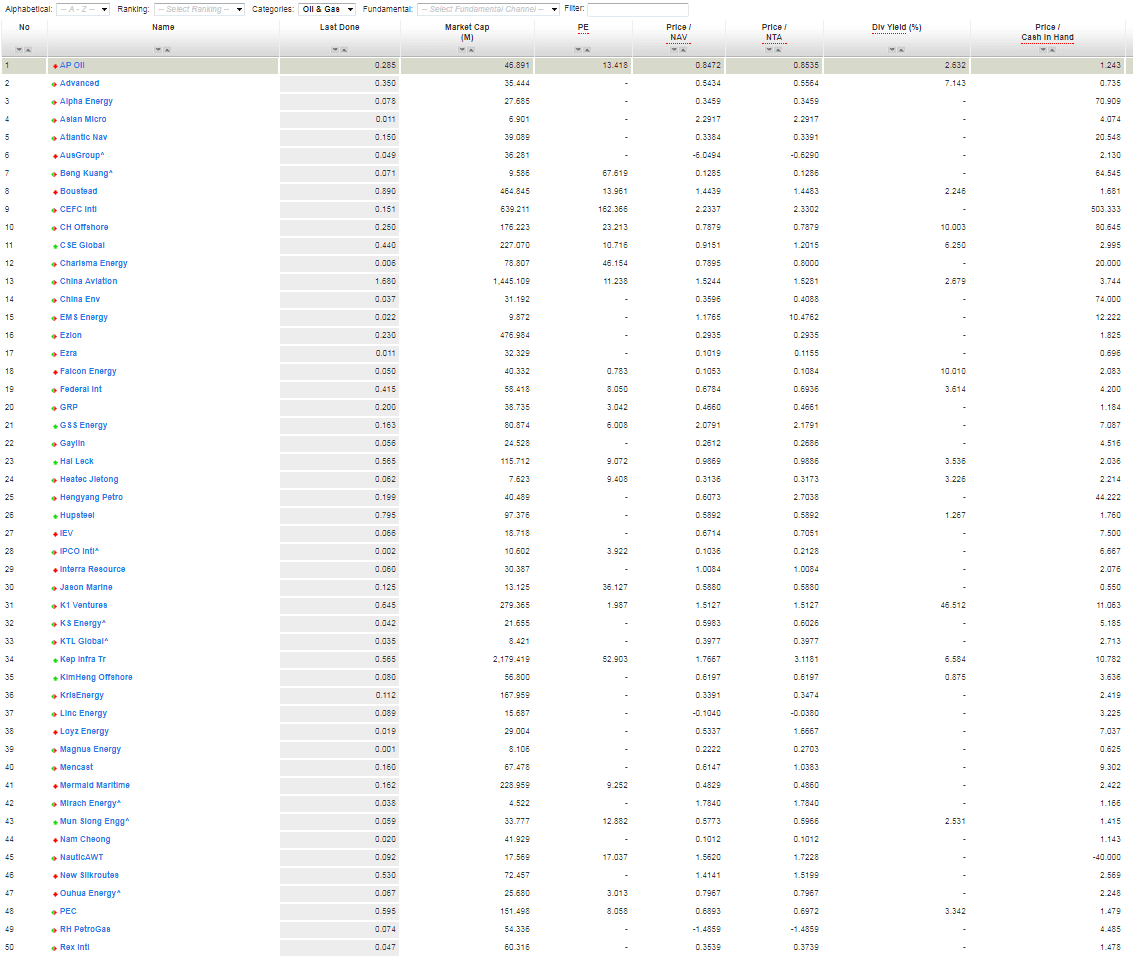
    Other Singapore REITs Comparison Table


Suntec REIT Stock Chart & Technical Analysis

Suntec REIT is s currently trading in an uptrend channel but will be reaching the previous high of $2.00 soon.


Singapore REITs Office Sector Comparison

Check out longest running Singapore REITs Hands on Course & Training here.

Click here to find out Singapore REITs Portfolio Advisory


Continue ReadingSuntec REIT Fundamental & Technical Analysis

Crude Oil: Dead Cat Bounce in Bear Market?

  • Post author:

Crude Oil have reached the critical resistance turned support (at about $43 from the chart) after entering into a Bear Market. The recent plunge for oil into bear-market territory, defined as a drop from a recent peak of at least 20%, comes as a consortium led by the Organization of the Petroleum Exporting Countries have failed to stabilize prices, despite a recently reupped pact to limit production until March 2018.

If this $43 support holds, a Dead Cat Bounce to the down trend channel resistance is expected. Dead Cat Bounce is an opportunity to get out in the bear market.  If you are holding all oil & gas sensitive stocks and corporate bonds in Singapore like Keppel Corp, SembCorp and other 50 stocks I have screened using ShareInvestor, prepare for the rough ride if the Crude Oil break the $43 critical support and further downside is expected. It is time to review your portfolio what is your exposure to the energy and Oil & Gas sector, and re-balance  or hedge your portfolio if necessary.

Energy Sector ETF (XLE) is also trading in a clear down trend.


Last word: Trade & Invest based on what you see, NOT based on what you think, what you hope and what you hear.

Start review your portfolio NOW !

Safe investing!


Continue ReadingCrude Oil: Dead Cat Bounce in Bear Market?

United States Oil Fund (USO): Short Term Rebound from Support

  • Post author:

United States Oil Fund (USO) rebounded from the $9.50 support.

The medium trend is down as USO has formed a “Lower High, Lower Low” down trend channel (in green). Long term trend USO is trading side way between $9.50 to $12.00.

USO has to stay above $10.00 for successful short term rebound. If $10.00 become the resistance and $9.50 support is broken, more downside expected for USO.


Original post from https://mystocksinvesting.com


Continue ReadingUnited States Oil Fund (USO): Short Term Rebound from Support