Kepland: Has Elliott Wave 5 Completed?

  • Post author:

Kepland seems like trading at the Wave 5 of an Elliott Wave.  It is still not clear that whether Wave 5 has completed before starting the Wave A.

Things to watch out for:

  • If Kepland is able to stay above $4.50, the stock price will probably go up to $4.90 (138.3% Fibonacci Retracement Level) to continue Wave 5.
  • If Kepland is unable to break this $4.50 resistance level, this probably indicates the end of Wave 5 and Wave A will be in formation. Price target of the corrective Wave A is $3.84 which is also a 200D MA.

Continue ReadingKepland: Has Elliott Wave 5 Completed?

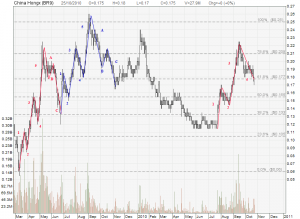
China HongXing: Repeating the Elliott Waves

  • Post author:

Have observed several Elliott Wave Patterns in China HongXing. The attached China HongXing charts have shown two complete Elliott Wave patterns (Wave 1 – 5, Wave A, B, C) previously. Now China HongXing is showing the another potential Elliott Wave pattern showing the Wave 4 in formation. If you believe in Elliott Wave pattern and believe the history may repeat itself, you should be able to predict the next movement by studying how the Wave 5 performed on the previous two occasions.

Past two Wave 5 performance:

  • From $0.13 to $0.21 in two weeks (61.5% increase)
  • From $0.18 to $0.25 in two weeks (38.8% increase)
  • Take note of the Fibonacci numbers (61.8%, 38.2%)…. A coincidence?

So, next performance? From $0.175 to ???? in ?? weeks?

Look at the China HongXing chart and make your prediction!

Welcome to post your prediction here!


Continue ReadingChina HongXing: Repeating the Elliott Waves

Keppel Land: Elliott Wave Observed

  • Post author:

An Elliott Wave has been formed on Keppel Land and seems that currently KepLand is trading in Wave A now. Short term Wave A target is at  least reach $3.50 which is 78.6% Fibonacci Retracement Level. Coincidently this level is also a 200D MA support. Base on the chart pattern, KepLand is bearish. Other technical indicators like MACD, RSI, Stochastic, Bollinger Band, Parabolic SAR are supporting the bearish view.

If KepLand rebounds at the 200D MA support, that possibly indicates end of Wave A and start Wave B. It is important to see whether this 200D MA support is strong enough.

Continue ReadingKeppel Land: Elliott Wave Observed