ST Engineering: Elliott Wave C Down!

  • Post author:

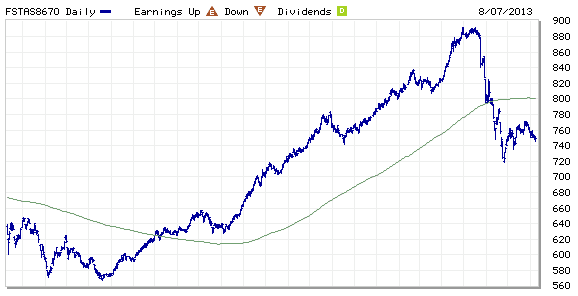
ST Engineering broke down from the Rising Wedge and is currently testing 200D SMA. If this 200D SMA support is broken, there will be a huge down side to go base on Elliott Wave pattern (Wave C Down). Sit tight!

2013Aug20-ST Engg-800x600

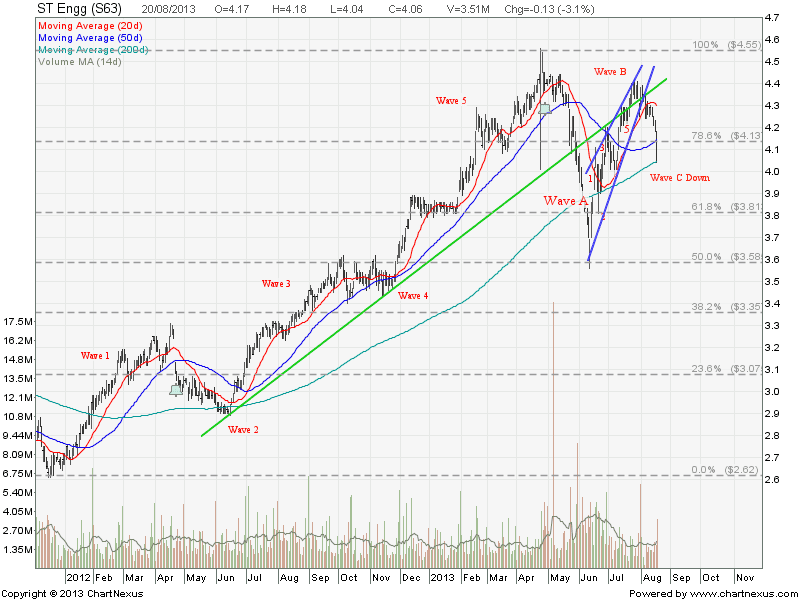
See last analysis on ST Engineering.

Key Statistics for STE

Current P/E Ratio (ttm) 21.5728
Estimated P/E(12/2013) 20.1990
Relative P/E vs. FSSTI 1.6640
Earnings Per Share (SGD) (ttm) 0.1882
Est. EPS (SGD) (12/2013) 0.2010
Est. PEG Ratio 2.4336
Market Cap (M SGD) 12,606.04
Shares Outstanding (M) 3,104.94
30 Day Average Volume 1,646,100
Price/Book (mrq) 6.8085
Price/Sale (ttm) 1.9539
Dividend Indicated Gross Yield 1.72%
Cash Dividend (SGD) 0.0300
Last Dividend 08/21/2013
5 Year Dividend Growth -0.09%
Next Earnings Announcement 11/07/2013
Continue ReadingST Engineering: Elliott Wave C Down!

Singapore REIT Fundamental Analysis Comparison Table – 9 Aug 2013 (Singapore National Day)

  • Post author:

FTSE ST Real Estate Investment Trusts (FTSE ST REIT) Index changes from 767.53 to 749.17 compare to last post on Singapore REIT Fundamental Comparison Table on July 26, 2013. The index is trading below 200D SMA and technically bearish. Looks like the index also breaks the recent rebound uptrend support line and may start Elliott Wave C (down!!).

FTSE ST REIT Index Aug9-013Compare to last SREIT comparison table:

  • Price/NAV decreases from 1.086 to 1.0568.
  • Dividend Yield increases from 5.78% to 5.91%.
  • Gearing Ratio remains the same at 33.01%.

Singapore REIT Fundamental Analysis Comparison 9-Aug-2013

Bubble Chart (Distribution Yield vs Price/NAV) – Value for Money

Singapore REIT Bubble Chart (Dist Yield vs NAV) Aug9-2013

Bubble Chart (Gearing Ratio vs Price/NAV) – Risk Avoidance

Singapore REIT Bubble Chart (Gearing vs NAV) Aug9-2013Find out how I do research on Singapore REIT, how to interpret those financial ratio in the comparison table, what opportunities can you find and what REITs should you avoid from the Bubble Charts, plus when to buy & when to sell using simple Trend Analysis. Check out my next public tutorial on  “How to pick Singapore REIT for Dividend Investing” .

Continue ReadingSingapore REIT Fundamental Analysis Comparison Table – 9 Aug 2013 (Singapore National Day)

FTSE ST Real Estate Index: Elliott Wave B ended?

  • Post author:

FTSE ST Real Estate is showing a Elliott Wave pattern. Currently the index is trading in a Wave B. Wave C (bearish wave) will start if the index break the support of 733.5. It is important to monitor the FTSE ST Real Estate Index because we can detect whether there is any strength or weakness in property counters to plan our trade.

Analysis by Marubozu https://mystocksinvesting.com

FTSE ST Real Estate Index July 21-2013

If the sector is weak, we can look for the Top 10 components stock to short by looking at the individual stock chart.

FTSE ST Real Estate Top 10 Companies

Look at Hongkong Land’s chart and you can see the weakness of the stock. The stock is trading in a down trend channel.

HK Land July21-2013

Although Global Logistic Properties (GLP) is still on uptrend but be cautious that a Head and Shoulders may be in formation.

2013July21-GLOBAL LOGISTIC PROP LIMITED-800x600

Capitaland’s chart is bearish and trading in down trend.

2013July21-Capitaland-800x600

Continue ReadingFTSE ST Real Estate Index: Elliott Wave B ended?