ST Engineering: Elliott Wave A in Action

  • Post author:

ST Engineering has broken the uptrend support and started a correction. Base on the chart pattern, ST Engineering has completed Wave 5 (top at 261.8% Fibonacci Extension) and is currently trading in Wave A of Elliott Wave.

Things to look out for:

  • ST Engineering may be finding a support between $4.00 to $4.06. This is another uptrend support and also 61.8% Fibonacci Retracement support for Elliott Wave 5. If ST Engineering does rebound from this level, this indicates the end of Wave A (bearish) and start of Wave B (bullish rebound).
  • Wave B rebound will potential forming a Head and Shoulder. The resistance will be at about $4.22 and 20D / 50D SMA.
  • Watch for reversal candlestick pattern when Wave B reaches the resistance. Plan for a trade to short ST Engineering when the right shoulder is in formation.

2013June1-ST Engg-800x600

See previous Fundamental Analysis and Intrinsic Value calculation of ST Engineering here.

Continue ReadingST Engineering: Elliott Wave A in Action

Capitaland: Elliott Wave C Down?

  • Post author:

Could the recent rebound of Capitaland has ended and found the recent top at $3.85? If yes, it looks like Capitaland is trading in a Elliott Wave C now.

A few things to watch:

  • $3.66 is the recent support. It may be forming a Head and Shoulder with neckline at $3.66. 
  • $3.60 support.
  • 50D SMA support which use to be a reliable support base on recent pattern.
  • 200D SMA support.
  • $3.40 support (61.8% Fibonacci Retracement Level). Breaking this support will confirm the Wave C, also confirm the down trend for Capitaland.

2013May26-Capitaland-800x600

Key Statistics for CAPL

Current P/E Ratio (ttm) 15.7759
Estimated P/E(12/2013) 20.7955
Relative P/E vs. FSSTI 1.1373
Earnings Per Share (SGD) (ttm) 0.2320
Est. EPS (SGD) (12/2013) 0.1760
Est. PEG Ratio 0.4905
Market Cap (M SGD) 15,581.79
Shares Outstanding (M) 4,257.32
30 Day Average Volume 11,473,200
Price/Book (mrq) 1.0133
Price/Sale (ttm) 4.6834
Dividend Indicated Gross Yield 1.91%
Cash Dividend (SGD) 0.0700
Last Dividend 05/03/2013
5 Year Dividend Growth -10.84%
Next Earnings Announcement 08/01/2013
Continue ReadingCapitaland: Elliott Wave C Down?

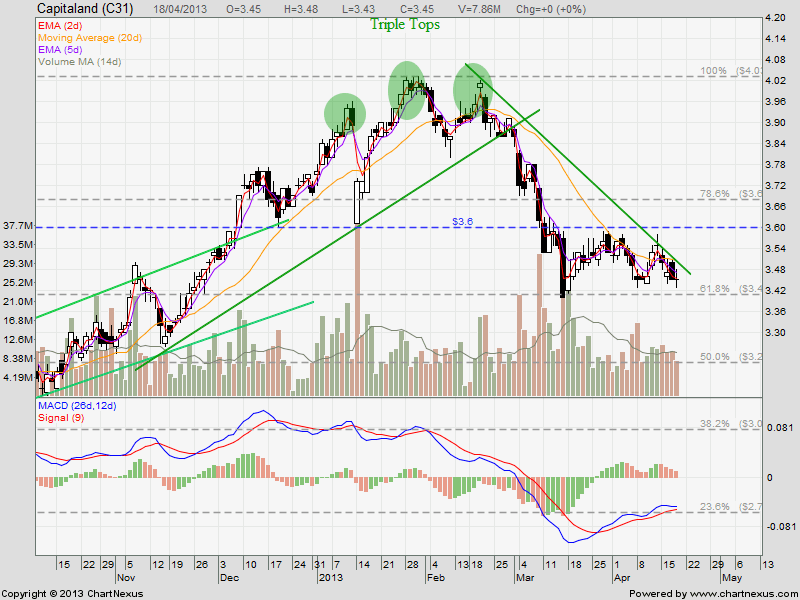
Capitaland: Range Bound But Watch $3.40!

  • Post author:

Capitaland is currently trading within a range between $3.40 and $3.60. Key support to watch is $3.40. Breaking this support will form a “Lower Low, Lower High” bearish chart pattern. 200D SMA is about $3.40. In addition, this is also the 61.8% FR level.

In addition, breaking this support will start a Wave C. See previous Elliott Wave pattern on Capitaland here.

Keep a BIG eye on this level!

2013April18-Capitaland-800x600

Continue ReadingCapitaland: Range Bound But Watch $3.40!