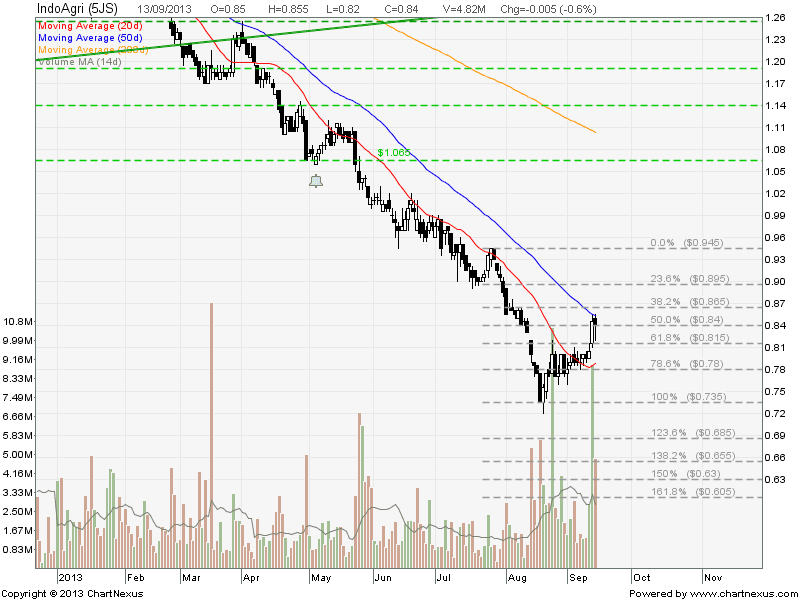
Indofood Agri: Hanging Man!

  • Post author:

Hanging Man at 50D SMA resistance. Potential reversal for recent rebound! Wait for confirmation!

The trend remains down!

2013Sept14-IndoAgri-800x600


Original post by Marubozu from My Stocks Investing Journey.


Key Statistics for IFAR

Current P/E Ratio (ttm) 17.9524
Estimated P/E(12/2013) 19.1573
Relative P/E vs. FSSTI 1.4049
Earnings Per Share (IDR) (ttm) 412.0000
Est. EPS (IDR) (12/2013) 385.8120
Est. PEG Ratio
Market Cap (M SGD) 1,196.40
Shares Outstanding (M) 1,424.28
30 Day Average Volume 2,909,467
Price/Book (mrq) 0.7658
Price/Sale (ttm) 0.7959
Dividend Indicated Gross Yield 1.01%
Cash Dividend (SGD) 0.0085
Last Dividend 05/06/2013
5 Year Dividend Growth
Next Earnings Announcement 10/31/2013
Continue ReadingIndofood Agri: Hanging Man!

Wilmar: Pulling Back Soon?

  • Post author:

Wilmar seems to be rejected at 200D SMA with a Bearish Engulfing candlestick pattern on daily chart. A Hanging Man is observed on weekly chart. Both candlestick pattern point to potential reversal in coming days. Opportunity to take profit for those who already have the position and buy on retracement for those who have missed the early boat.

On bullish side, Wilmar is forming a Bullish Pennant. So, also watch out a bullish breakout if retracement does not happen.

Continue ReadingWilmar: Pulling Back Soon?

UOB Bank: Facing Very Tough Resistance

  • Post author:

UOB Bank is facing very tough resistance at $19.85. UOB was unable to break this resistance for past 9 occasions in 3 years. If UOB manages to break this level, the stock will face next important resistance of $20.00 (round number and psychological resistance) immediately. At current price, the downside risk is much higher than upside potential. UOB is showing a Hanging man at the resistance indicates potential reveral with uptrend support at about $19.20. Breaking this support will send UOB to $18.80 (200D SMA) followed by $18.12 (61.8% Fibonacci Retracement Level). I am waiting for the right moment to short the stock using CFD.

Key Statistics for UOB

Current P/E Ratio (ttm) 12.1782
Estimated P/E(12/2012) 11.9039
Relative P/E vs. FSSTI 1.0045
Earnings Per Share (SGD) (ttm) 1.6275
Est. EPS (SGD) (12/2012) 1.6650
Est. PEG Ratio 0.8785
Market Cap (M SGD) 31,211.52
Shares Outstanding (M) 1,574.75
30 Day Average Volume 2,226,200
Price/Book (mrq) 1.4117
Price/Sale (ttm) 3.7446
Dividend Indicated Gross Yield 3.03%
Cash Dividend (SGD) 0.2000
Last Dividend 08/30/2012
5 Year Dividend Growth -5.09%
Next Earnings Announcement 02/22/2013
Continue ReadingUOB Bank: Facing Very Tough Resistance