Noble Group: Down Trend Ended?

  • Post author:

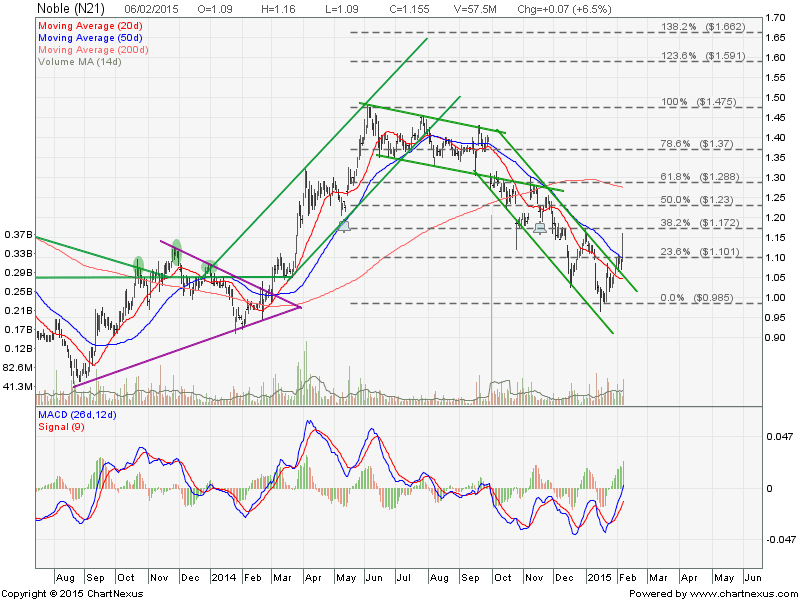
Noble Group has broken out from the Down Trend Channel resistance. This is the 1st sign of potential reversal pattern. Things to watch for the reversal confirmation:

  • 20D & 50D starts to trend up.
  • A Higher High, Higher Low chart pattern formation.
  • Noble has to clear $1.17 resistance (38.2% Fibonacci Retracement Level)
  • Potential formation of Inverted Head and Shoulders with neckline at $1.17.

Potential Entry Point (Long position):

  • Noble pull back to form the Right Shoulder (Inverted Head and Shoulders)
  • Breakout at $1.17 and turned this resistance to support level.

Original post by Marubozu from My Stocks Investing Journey.

2015Feb6-Noble Group

Current P/E Ratio (ttm) 9.8036
Estimated P/E(12/2014) 11.6948
Relative P/E vs. FSSTI 0.6525
Earnings Per Share (USD) (ttm) 0.0871
Est. EPS (USD) (12/2014) 0.0730
Est. PEG Ratio 0.1893
Market Cap (M SGD) 7,784.08
Shares Outstanding (M) 6,739.47
30 Day Average Volume 26,969,120
Price/Book (mrq) 1.1027
Price/Sale (ttm) 0.0605
Dividend Indicated Gross Yield 0.99%
Cash Dividend (USD) 0.0300
Dividend Ex-Date 11/18/2014
5 Year Dividend Growth 3.75%
Next Earnings Announcement 02/18/2015
Continue ReadingNoble Group: Down Trend Ended?

SPDR Gold ETF (GLD): Breakout from Inverted Head and Shoulders

  • Post author:

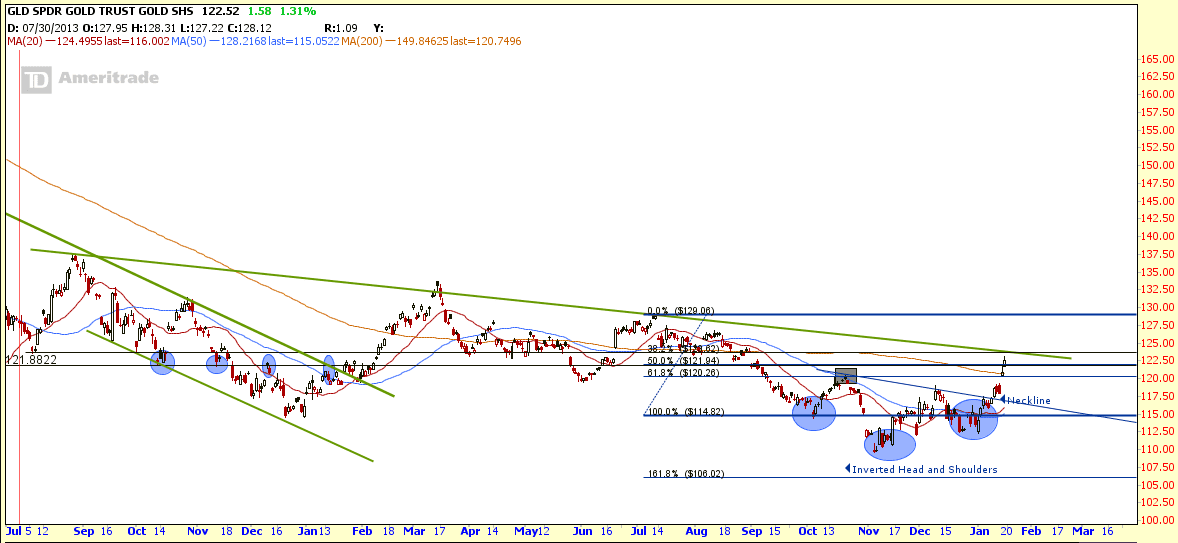
SPDR Gold ETF (GLD) breakout from Inverted Head and Shoulders and move above the 200D SMA. However GLD is going to face the resistance of the medium term declining trend resistance (green line). If GLD is able to break this resistance, there is a first sign of trend reversal.

Original post by Marubozu from My Stocks Investing Journey

GLD Jan16-2015

Continue ReadingSPDR Gold ETF (GLD): Breakout from Inverted Head and Shoulders

FTSE ST Real Estate Index April 2014 Review

  • Post author:

FTSE ST Real Estate Index Chart

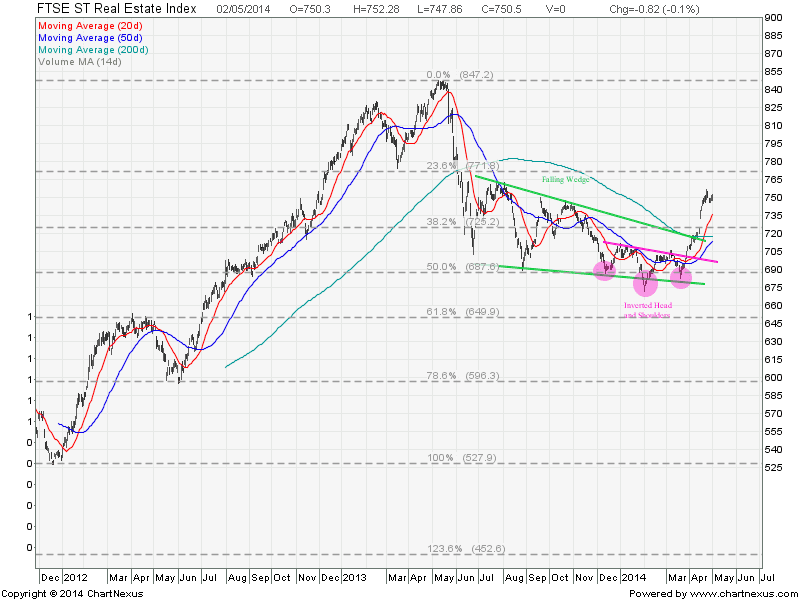
FTSE ST Real Estate Index has started a trend reversal in April 2014 after breaking out from a Falling Wedge. The index is currently starting an uptrend. So this is a good time to start to pick up some fundamentally strong property stocks and REITs.

FTSE ST Real Estate Index May3-2014

Last Analysis on Singapore Property Stocks and REITs here.

FTSE ST Real Estate Index Components Stocks (Total 50 Stocks)

All Top 10 Constituents posted positive gain in the month of April led by CapitaMalls Asia, CapitaCommercialTrust and Capitaland. Read the News here CapitaLand Offers S$3.06 Billion to Buy CapitaMalls Asia.

FTSE ST Real Estate Top 10 Companies April-2014

For Singapore REIT, Click here for Singapore REITs Fundamental analysis.

Fundamental Comparison for Key Component Stocks and Property Stocks

Property Stocks Fundamental Comparison May3-2014

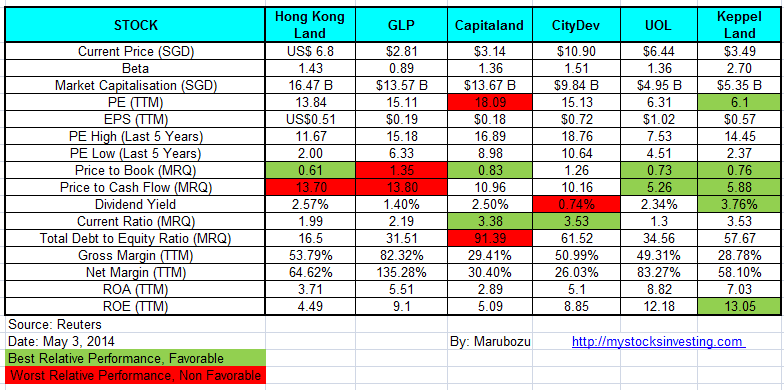
Check out how to use Fundamental Analysis to pick the right stocks, what is the meaning of PE Ratio, Current Ratio, ROA, ROE here. Price to Book Value remains attractive for Hong Kong Land, Capitaland, UOL and Keppel Land.

Hong Kong Land

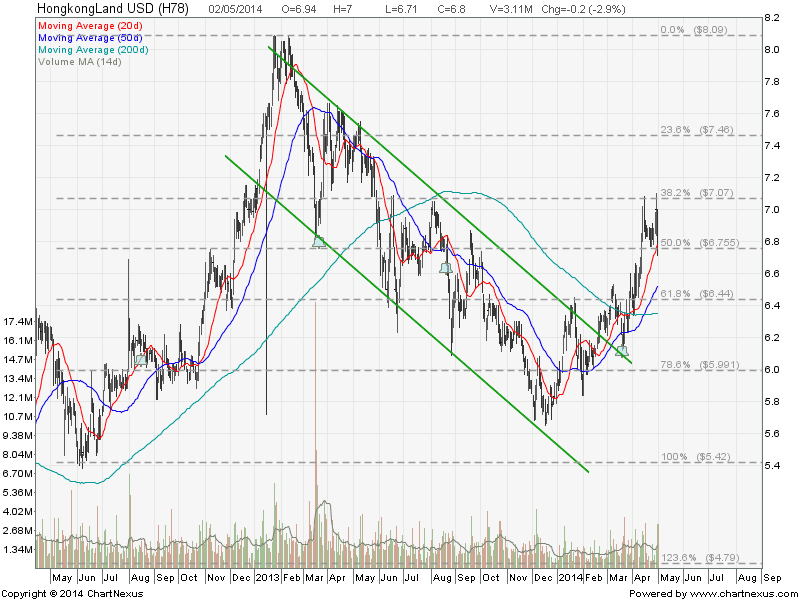
It is very clear that Hong Kong Land broke out from the down trend channel and reverse into uptrend. Currently Hong Kong Land is facing resistance at $7.00 but the stock is very well supported by the 20D & 50D SMA.

HK Land May3-2014

Global Logistic Properties

GLP has not reversed to uptrend yet and currently testing the declining trend line resistance and fighting to break the 200D SMA resistance.

2014May3-GLOBAL LOGISTIC PROP LIMITED-800x600

Capitaland

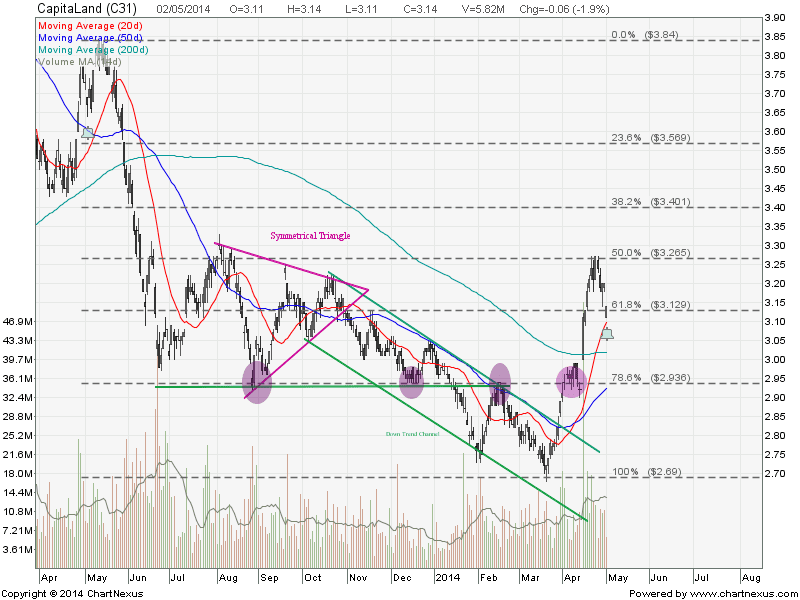
Capitaland has reversed to uptrend after finding a good support at $2.93. As long as Capitaland find the support at 200D SMA and $3.00 psychological level, the chart looks bullish. Fundamentally the valuation is very attractive with 17% discount to book value.

2014May3-Capitaland-800x600

City Development

City Development had a sharp rally in April. $10.70 is a significant resistance turned support level to watch.

2014May3-CITYDEV-800x600

UOL

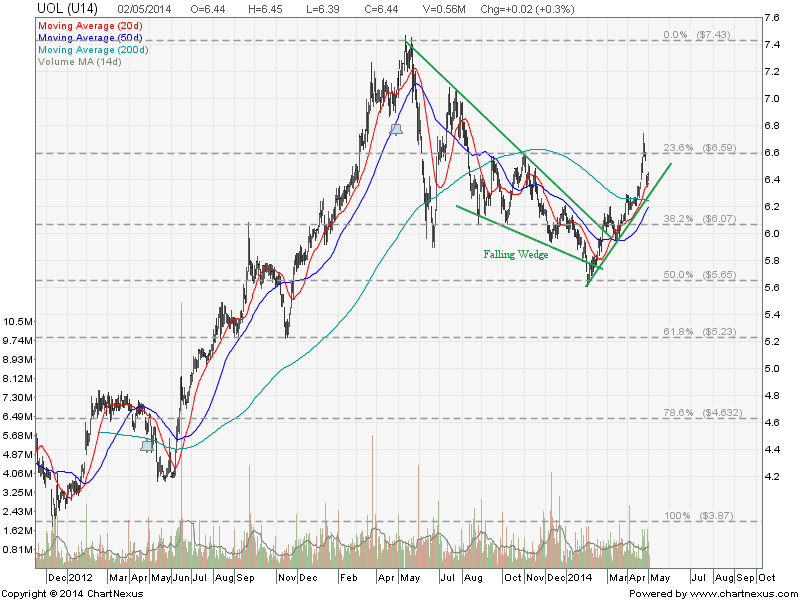
After breaking out from a Falling Wedge, UOL has reversed to uptrend and trading above the 20D, 50D and 200D SMA. Technically UOL retraces back to the uptrend support with 27% discount to book value fundamentally.

UOL May3-2014

Keppel Land

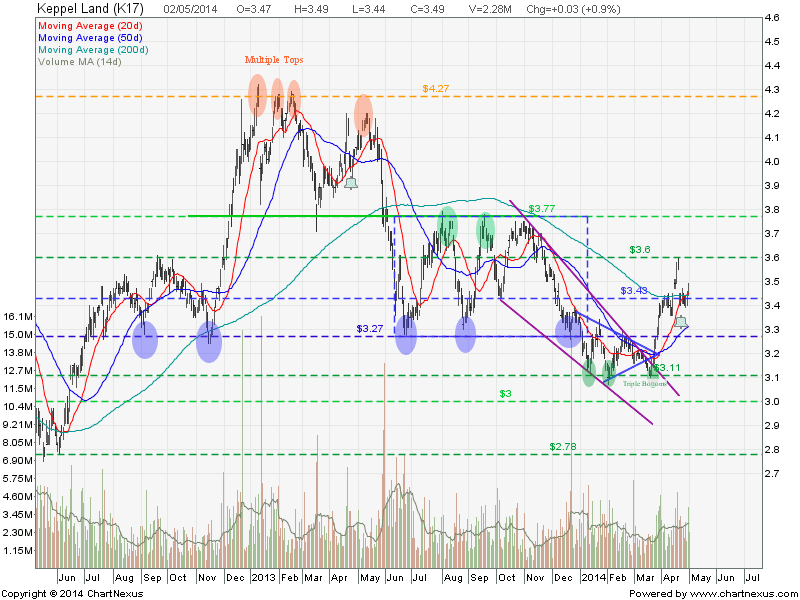
Keppel Land looks like finding a good support at 200D SMA. Now need to watch for 20D & 50D SMA to catch up to confirm the uptrend.

2014May2-KeppelLand

Check here to learn how to use Technical Analysis to study the stock charts.

Continue ReadingFTSE ST Real Estate Index April 2014 Review