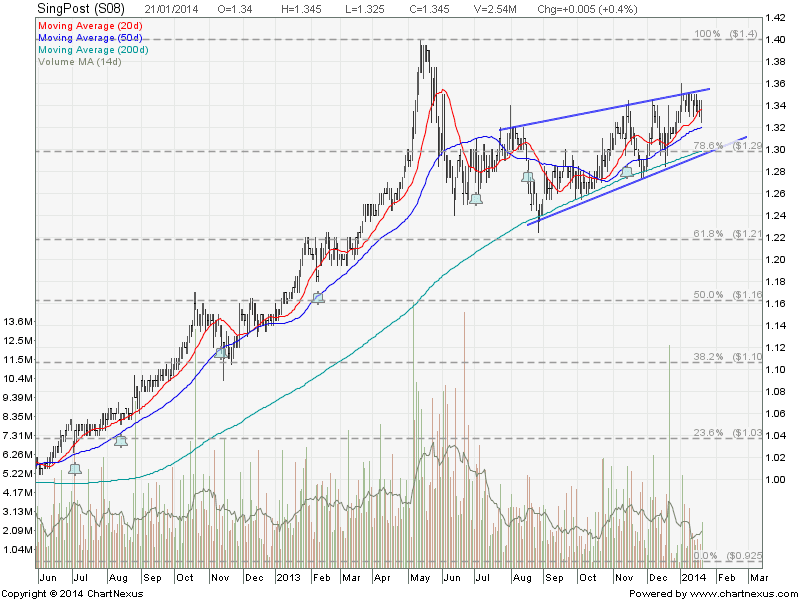
SingPost: Upside Limited
SingPost is currently trading in a Rising Wedge but up trend momentum is slowing down. Immediate resistance at $1.35 (the Wedge resistance) followed by $1.40 (Previous High). Upside is limited as the Current PE of SingPost is 20.5 with 4.66% Dividend Yield. There are many stocks with better dividend yield than SingPost.
Original post by Marubozu from My Stocks Investing Journey.
| Current P/E Ratio (ttm) | 20.5238 |
|---|---|
| Estimated P/E(03/2014) | 17.1795 |
| Relative P/E vs. FSSTI | 1.5494 |
| Earnings Per Share (SGD) (ttm) | 0.0653 |
| Est. EPS (SGD) (03/2014) | 0.0780 |
| Est. PEG Ratio | – |
| Market Cap (M SGD) | 2,560.42 |
| Shares Outstanding (M) | 1,910.76 |
| 30 Day Average Volume | 2,395,533 |
| Price/Book (mrq) | 7.8592 |
| Price/Sale (ttm) | 3.7725 |
| Dividend Indicated Gross Yield | 4.66% |
| Cash Dividend (SGD) | 0.0125 |
| Dividend Ex-Date | 11/13/2013 |
| 5 Year Dividend Growth | 0.00% |
| Next Earnings Announcement | 01/24/2014 |