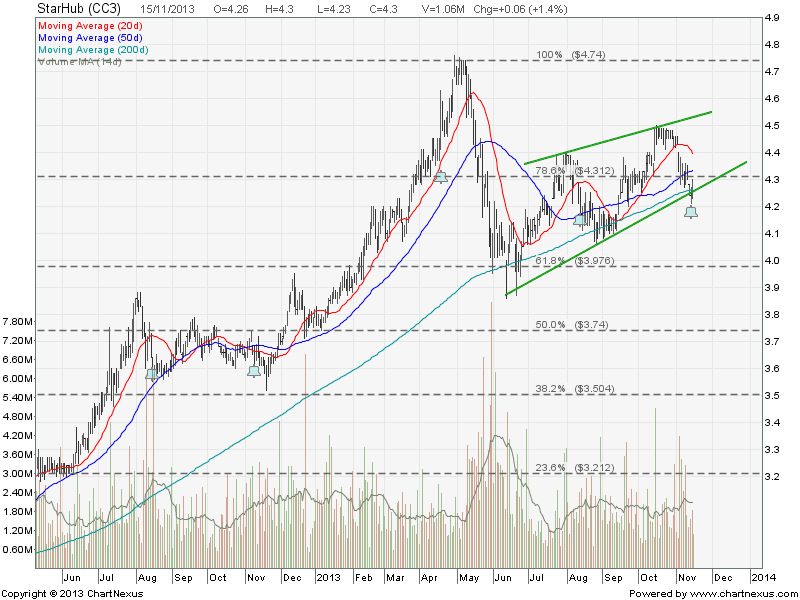
Starhub: Trading in a Rising Wedge
Starhub is currently trading in a Rising Wedge. Seems that rebound is happening at the Wedge support and 200D SMA support with a closing Marubozu candle.
Original post by Marubozu @ My Stocks Investing Journey.
Key Statistics for STH
| Current P/E Ratio (ttm) | 19.7520 |
|---|---|
| Estimated P/E(12/2013) | 19.9074 |
| Relative P/E vs. FSSTI | 1.4425 |
| Earnings Per Share (SGD) (ttm) | 0.2177 |
| Est. EPS (SGD) (12/2013) | 0.2160 |
| Est. PEG Ratio | 3.6934 |
| Market Cap (M SGD) | 7,393.65 |
| Shares Outstanding (M) | 1,719.45 |
| 30 Day Average Volume | 1,955,257 |
| Price/Book (mrq) | 89.1723 |
| Price/Sale (ttm) | 3.0812 |
| Dividend Indicated Gross Yield | 4.65% |
| Cash Dividend (SGD) | 0.0500 |
| Dividend Ex-Date | 11/13/2013 |
| 5 Year Dividend Growth | 2.13% |
| Next Earnings Announcement | 02/07/2014 |