Weekly Inter Market Analysis Sept 11-2016
Learnt about JW5IMA in PMP. I create a KL8WIMA (Kenny Loh 8 Weekly Inter Market Analysis) for my own market watch. The objective is to monitor the correlation of different asset class / sectors movement every week. Feel free to comment if there are better alternatives.
Original post from https://mystocksinvesting.com
A long awaited sell off finally came on Friday (Sept 9-2016) after 2 months of low volatility and trading in a tight range for US market. Has the correction finally came? Will the sell off continue next week?
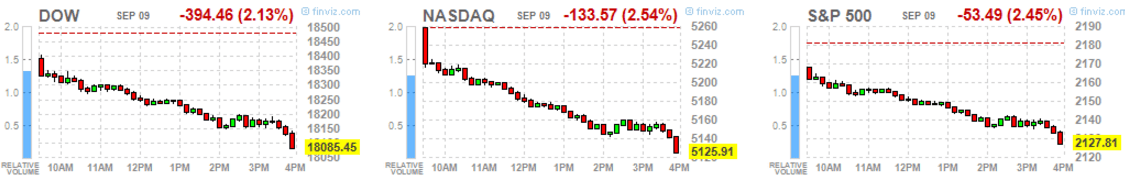

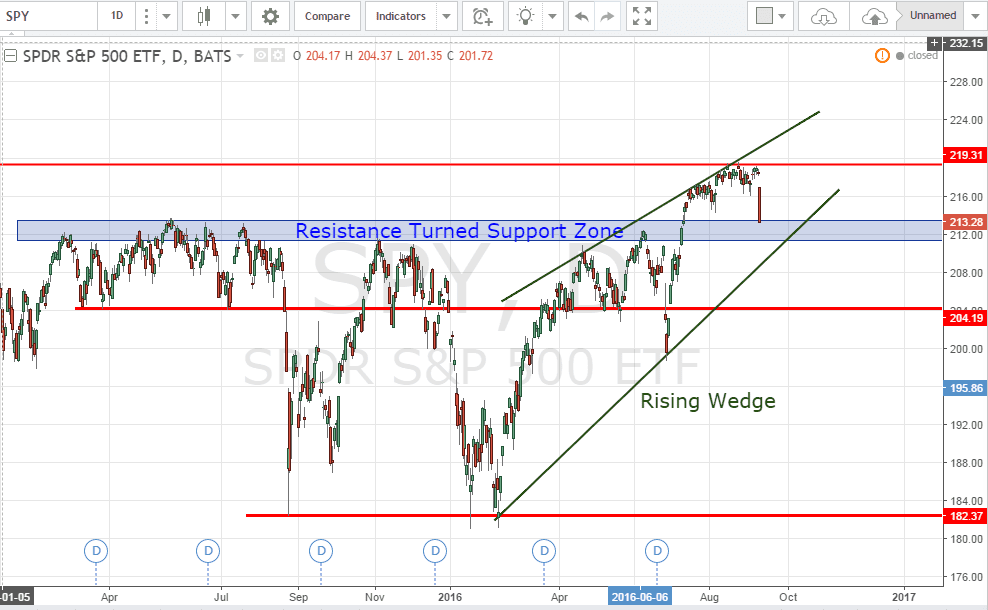
SPY (SPDR S&P500 ETF)
SPY gapped down and broken the support on last trading session. Next week will be crucial to see whether SPY can break the support to continue the sell off or rebound from here to continue the uptrend.
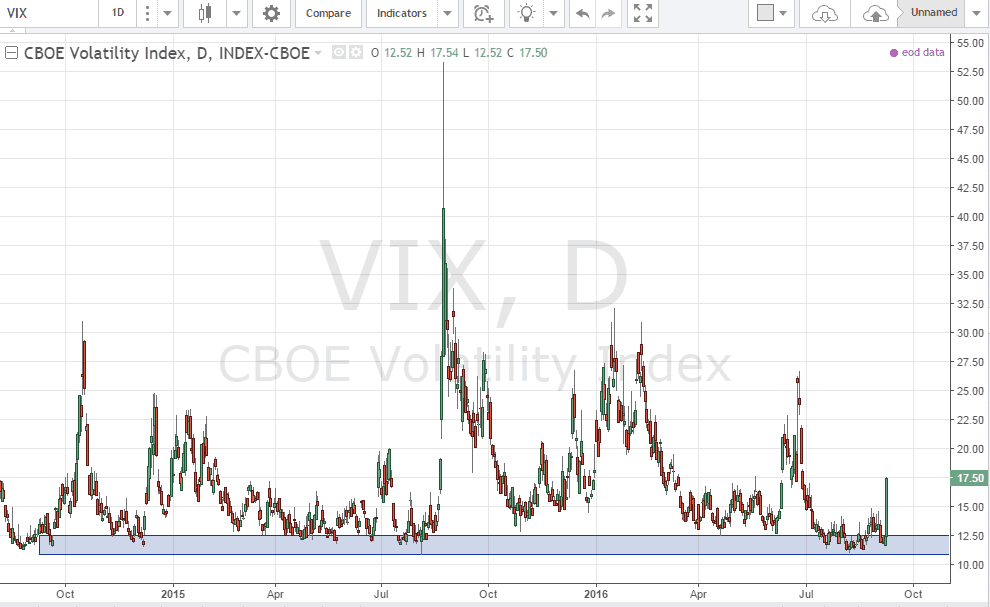
VIX
VIX spiked about 40% at last trading session. If VIX continues to move higher next week, tighten your seat belt!
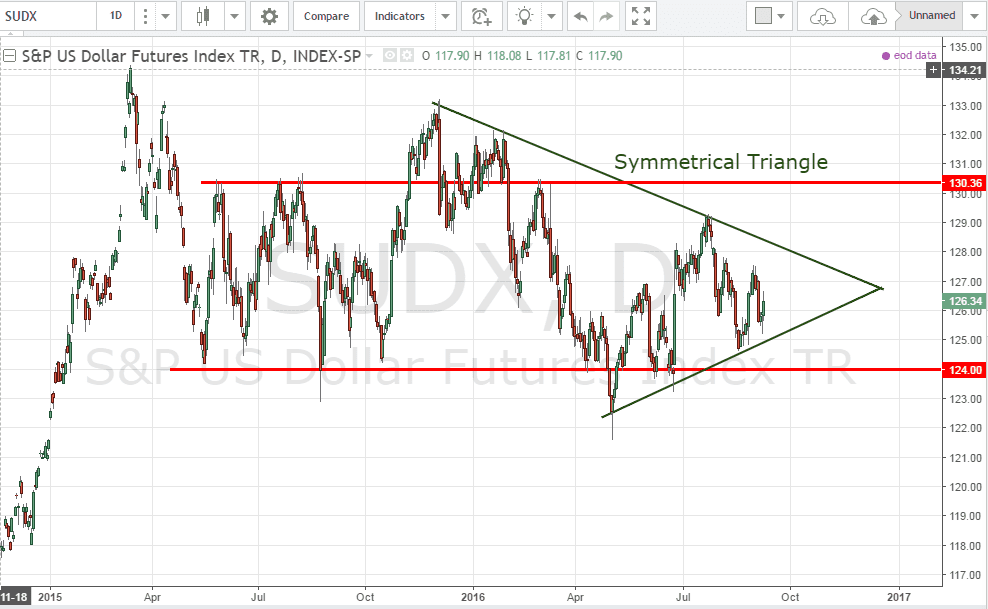
SUDX (S&P US Dollar Futures Index)
SUDX is currently trading within a Symmetrical Triangle and likely to be trading in a tight range until a breakout. Wait for Yellen’s speech on the interest rate hike confirmation.
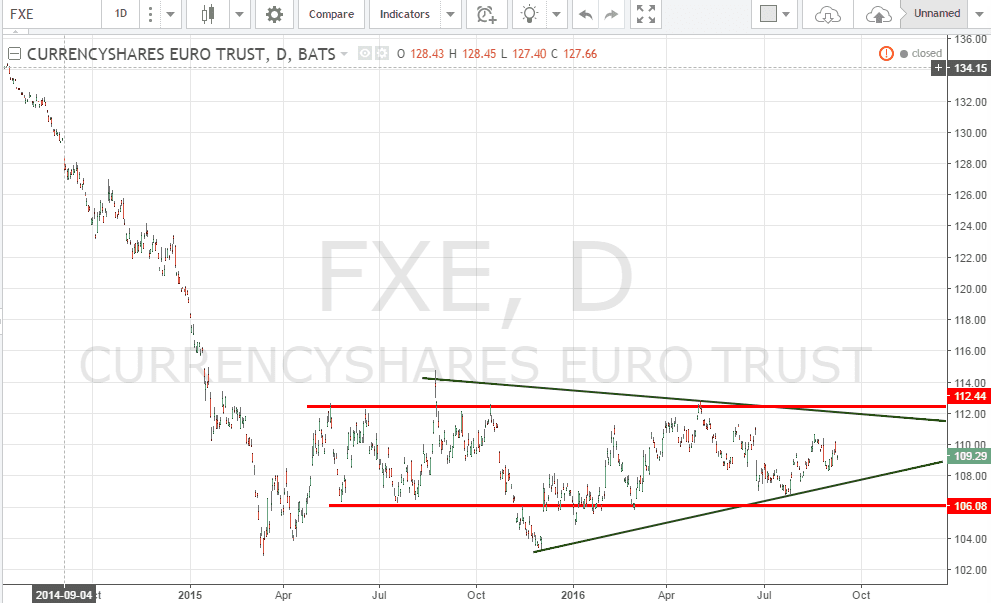
FXE (Currency Shares Euro ETF)
Down trend has stopped for FXE. FXE is curently trading sideway and range bound. Wait for Yellen’s speech on the interest rate hike confirmation before we can see the next big move.
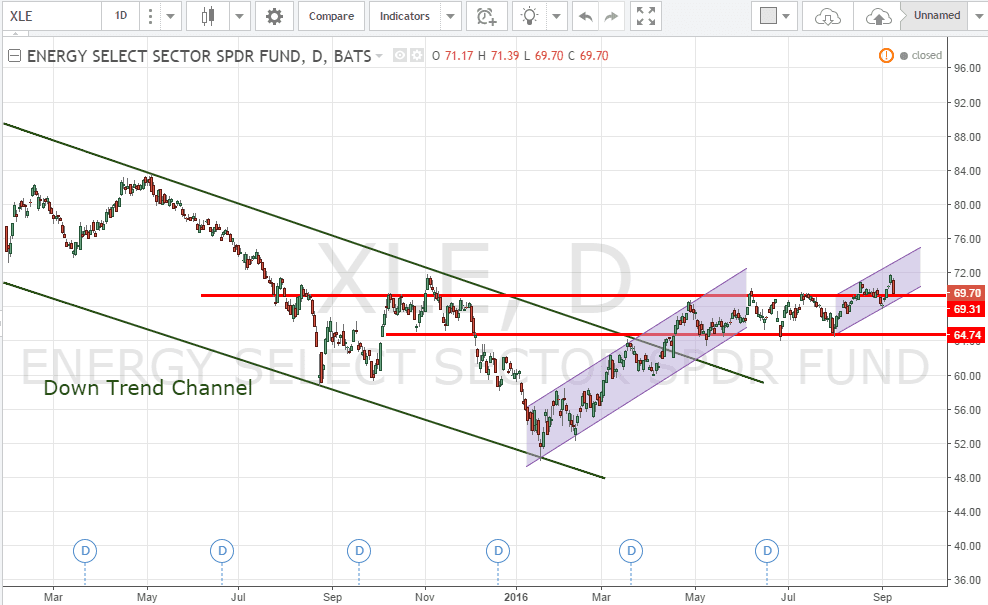
XLE (SPDR Energy Sector ETF)
XLE came out from the down trend channel and currently looks like reversing to the uptrend. Crude Oil has bottomed up?
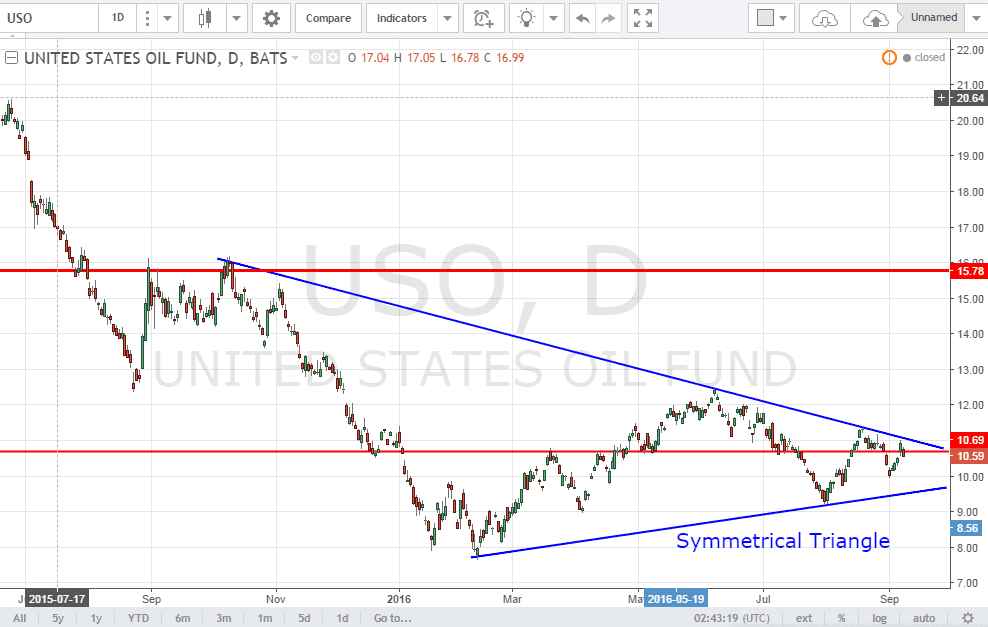
USO (United States Oil Fund)
USO is currently trading in a Symmetrical Triangle. Keep an eye on the next move when USO is trading closer to the apex of the triangle.
TLT (iShares 20+ Years Treasury Bond ETF)
SPY sold off, TLT sold off together? US Equity and Bond Market are moving in the same direction at the moment. This is not normal. Will the “Sell equity and move to bond in the bear market” strategy work moving forward? Base on the current equity and bond “synchronized movement”, we may need to watch this space very closely and rethink our portfolio re-balancing strategy.

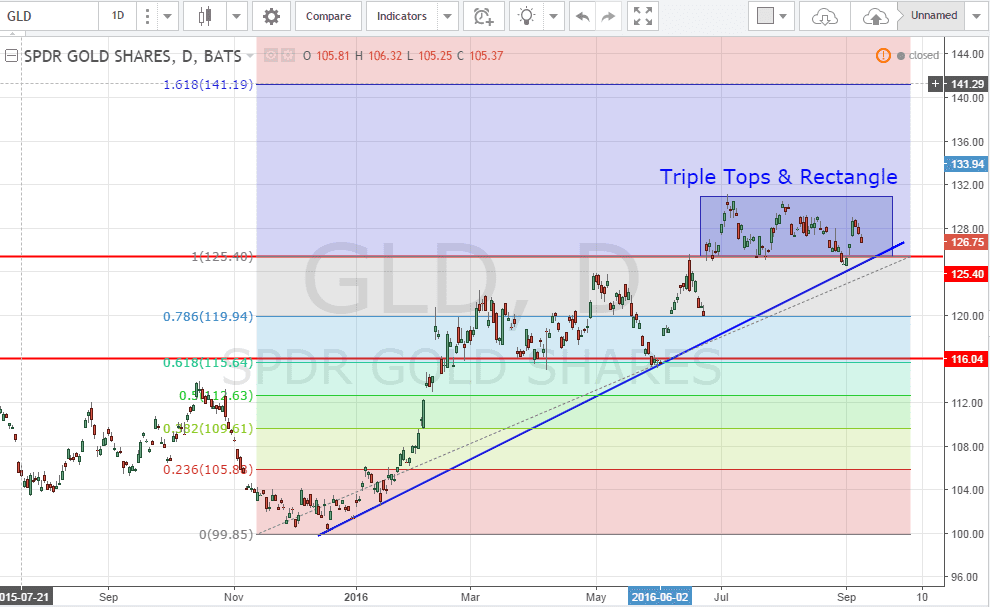
GLD (SPDR Gold Shares)
Gold is currently trading in a consolidation (Rectangle pattern) and still on uptrend. Expect GLD to move to 141.19 (161.8% Fibonacci Retracement Level) as long as the uptrend support holds. Can GLD be the safe harbor if Equity & Bond market sell off?
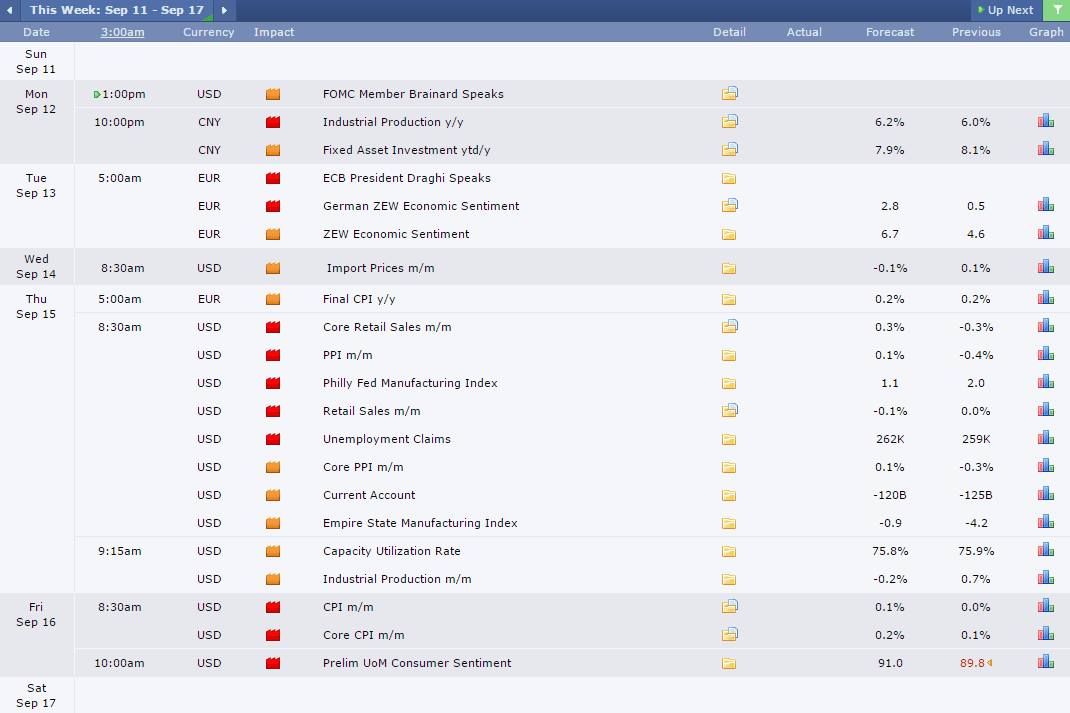
Next Week Economic Calendar