Walt Disney (DIS): Breakout to Start Up Trend
Walt Disney (DIS) broke out from the $67.89 resistance recently and retested this resistance turned support level to start an uptrend where a “Higher High, Higher Low” uptrend channel is formed. DIS also show a Fibonacci Expansion pattern (0%-100%-61.8%) with price target at 161.8% FR level of $80.73.
DIS Chart
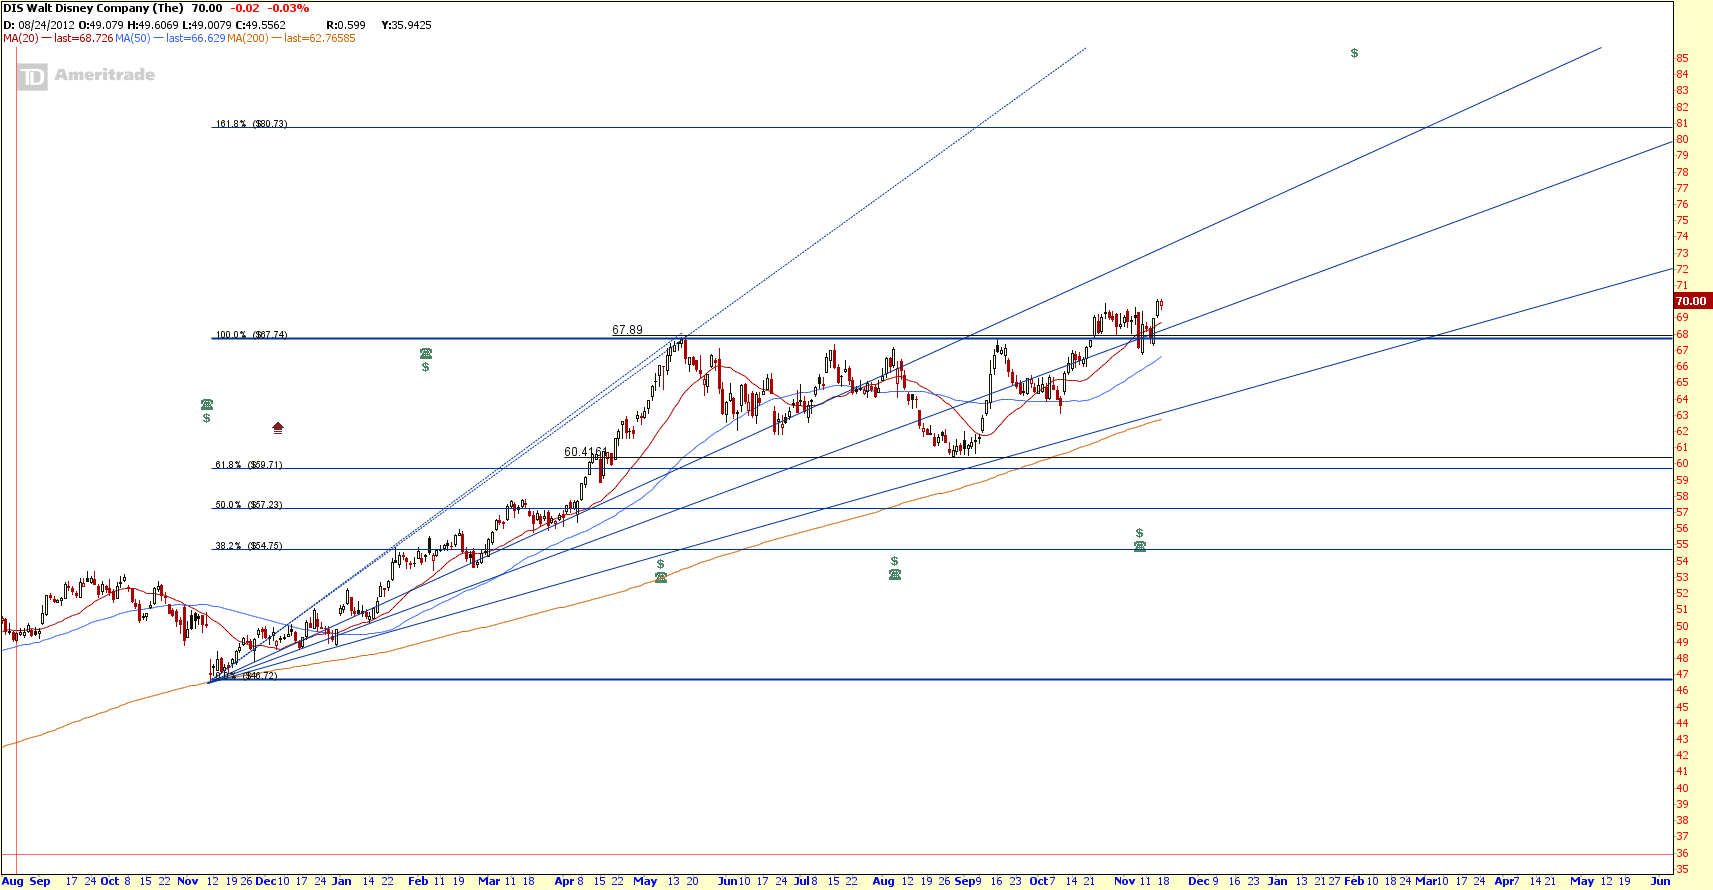
Chart from thinkorswim, get FREE chart here.
DIS Fundamental
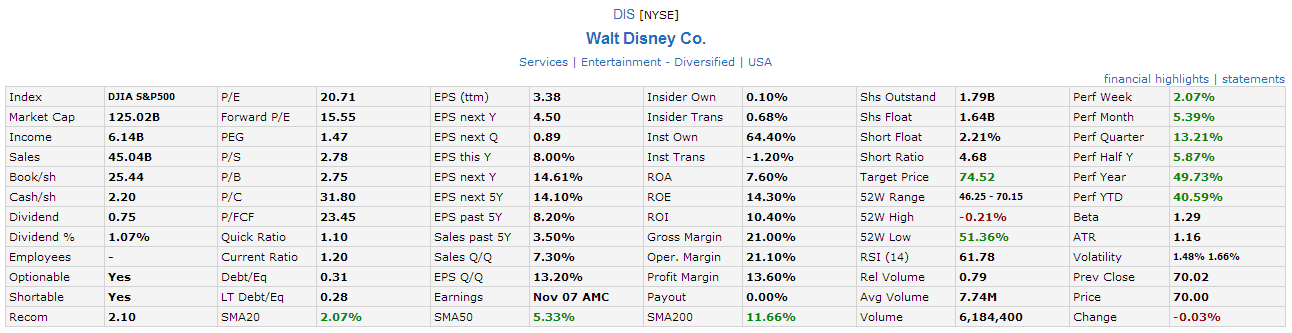
DIS Intrinsic Value
- Operating Cash Flow = $9,452 Million
- No of Shares outstanding = 1.79 Billion
- Beta = 1.29
- Discount Rate = 7%
- Conservative Growth (12% for next 10 years), IV = $68.6
- Moderate Growth (14.4% for next 10 years), IV = $76.62
- High Growth Rate (17% for next 10 years). IV = $84.71
Check out here if you want to learn about Fundamental Analysis and how to calculate Intrinsic Value using Discounted Cash Flow (DCF) model.
Original post by Marubozu from My Stocks Investing Journey.