Is US Stock Market Forming the Tops?
No one knows when the US stock market will reach the top. However, the following 4 charts are telling some stories.
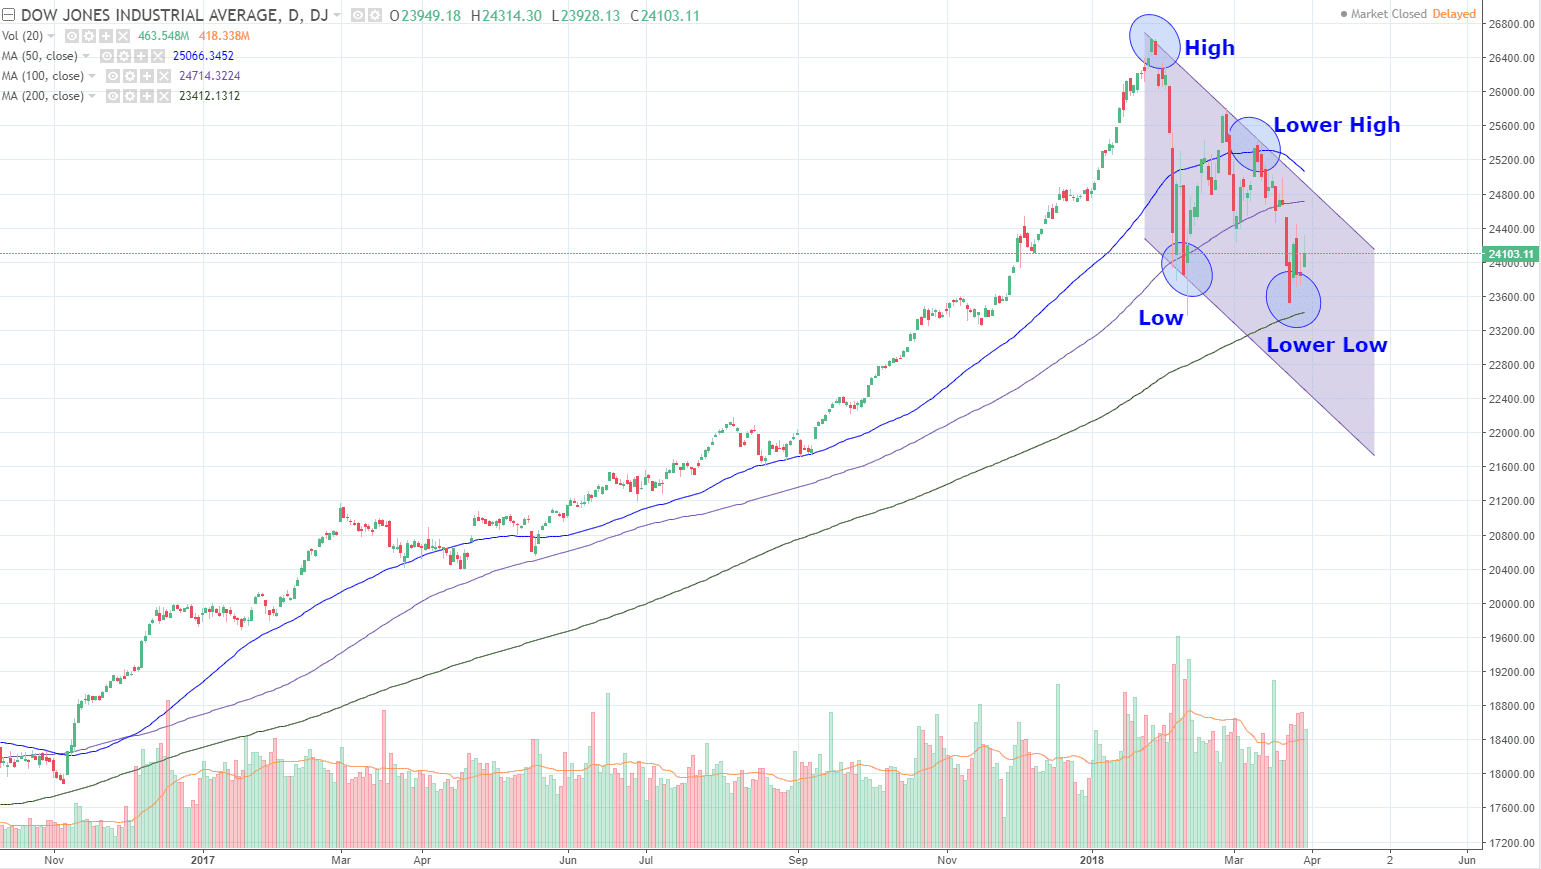
Dow Jones Industrial has already forming a short term “Lower High, Lower Low” bearish down trend channel pattern. Currently the index is only supported by 200D SMA. Long term up trend is still intact as 200D SMA is still sloping up. Is this only a short term correction or long term trend reversal? 200D SMA support is the key!
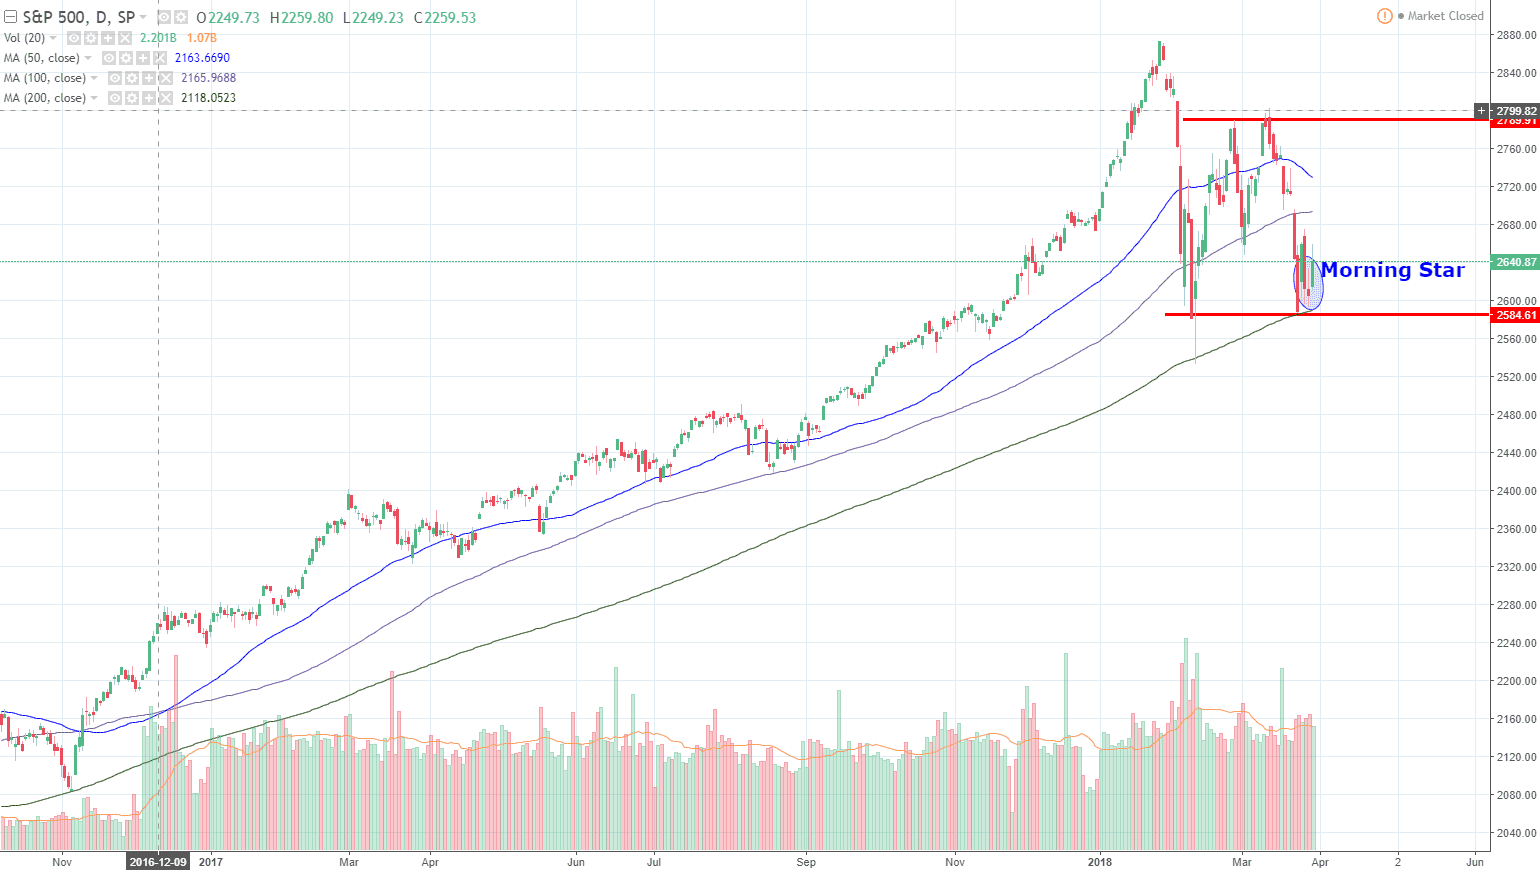
S&P 500 (SPX) is currently trading within a Rectangle consolidation pattern between 2800 and 2584. A Morningstar reversal candlestick was formed at the 200D SMA support indicates a potential rebound entering into the month of April. Long term uptrend is still in tact for SPX as the 200D SMA is still sloping up. Is it a mere correction or long term trend reversal? Watch the 200D SMA support!
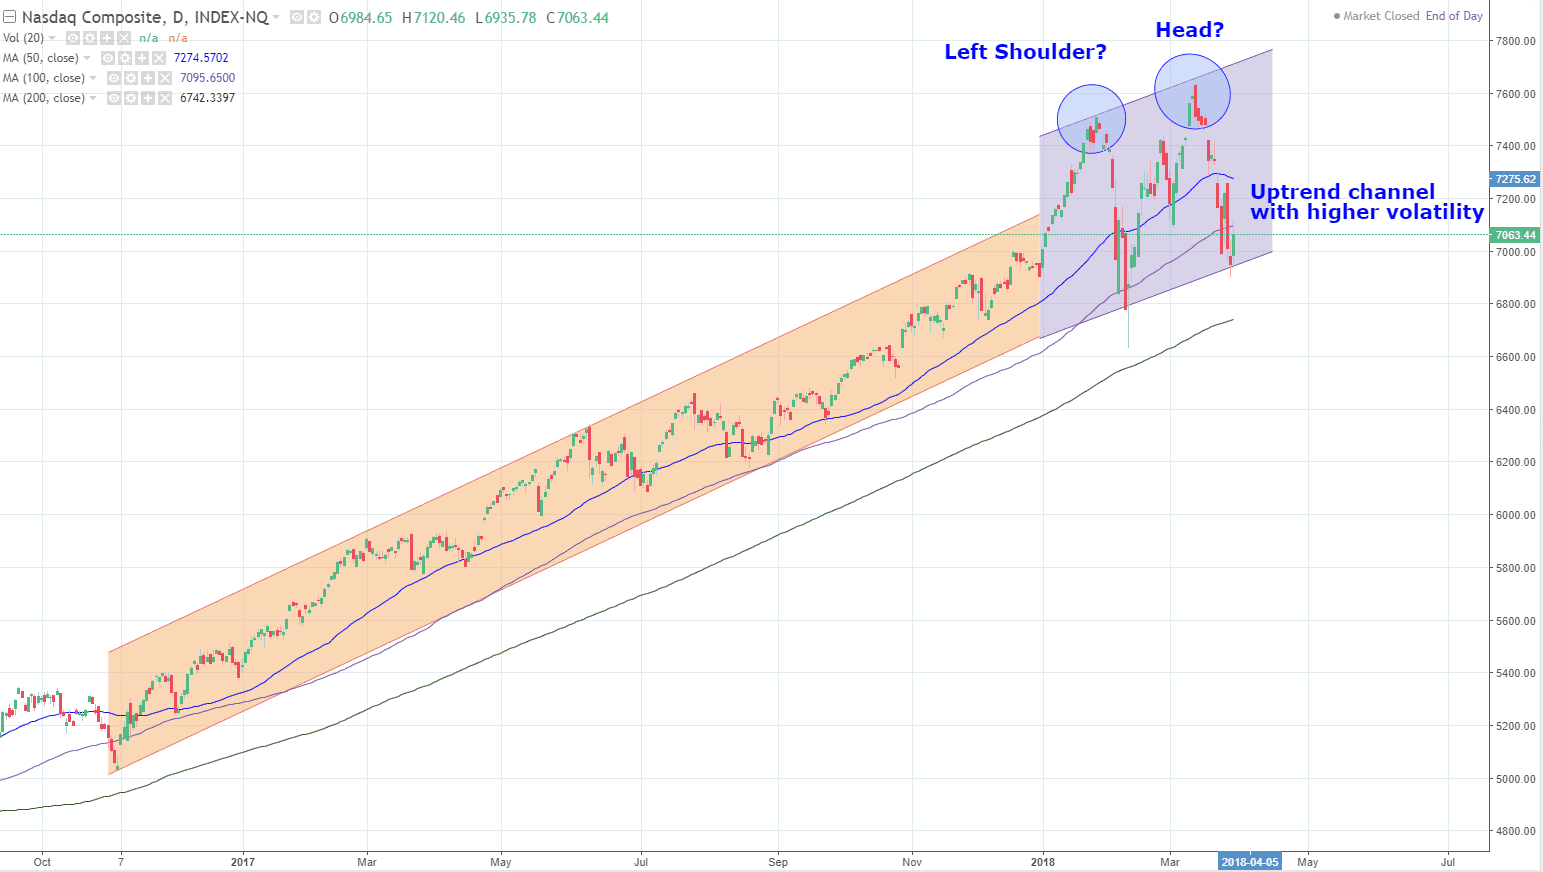
NASDAQ is still trading within an uptrend channel but volatility has increased since beginning of year 2018. NASDAQ is currently rebounded from the uptrend channel support. Keep a closed eye to see whether NASDAQ forms a Head and Shoulders reversal pattern or continue its uptrend.
Russel 2000 (RUT) has formed a Double Tops and currently is trading close to the uptrend support at about 1,511 and next support is at 200D SMA (about 1, 480). If these 2 supports are broken, the uptrend of RUT will be ended. If RUT breaks 1,607 resistance, more upside is expected. RUT long uptrend is still intact based on 200D SMA slope. 50D and 100D slope may be turning down.

