See previous week Weekly Inter Market Analysis.
Original post from https://mystocksinvesting.com
SPY (SPDR S&P500 ETF)
SPY rebounded from the resistance turned support zone. SPY is still trading in a Rising Wedge pattern and on uptrend after forming “higher high, higher low” chart pattern. Keep an eye on on key supports:
- Resistance turned support zone: 211-213
- Rising Wedge immediate support: about 210
- Previous Head and Shoulders neckline support: about 204.
- Rising Wedge next support: about 200
The following is the S&P500 Q2 2016 Earning Dashboard.
- Close to 100% has released earning.
- 71% have reported earnings above analyst expectations, 11% reported earnings in line with analyst expectations and 18% reported earnings below analyst expectations.
- 53% have reported Q2 2016 revenue above analyst expectations, 0% reported earnings in line with analyst expectations and 47% reported earnings below analyst expectations.
-
S&P 500 Earnings Dashboard | Sep. 27, 2016
VIX
VIX stays below 15 – a complacent zone.
Sector Performance (SPDR Sector ETF)
- Best Sectors: Energy (XLE)
- Worst Sector: Utility (XLU)
SUDX (S&P US Dollar Futures Index)
SUDX is still trading within a Symmetrical Triangle and likely to be trading in a tight range until a breakout. No rate hike from last FOMC statement. Next FOMC statement on Nov 1/2.
FXE (Currency Shares Euro ETF)
FXE is curently trading sideway and range bound. No rate hike from last FOMC statement. Have to wait till next FOMC statement on Nov 1/2 before we can see the next big move.
XLE (SPDR Energy Sector ETF)
Uptrend channel redrawn. XLE moves above 69.31. Critical support at 64.74 which has been tested for 5 times.
USO (United States Oil Fund)
USO is still trading in a Symmetrical Triangle. Currently testing the triangle resistance at about 11.00. Watch for the breakout.
TLT (iShares 20+ Years Treasury Bond ETF)
TLT is just resting on the 137.51 support. If the support is broken, TLT may continue to move downward.
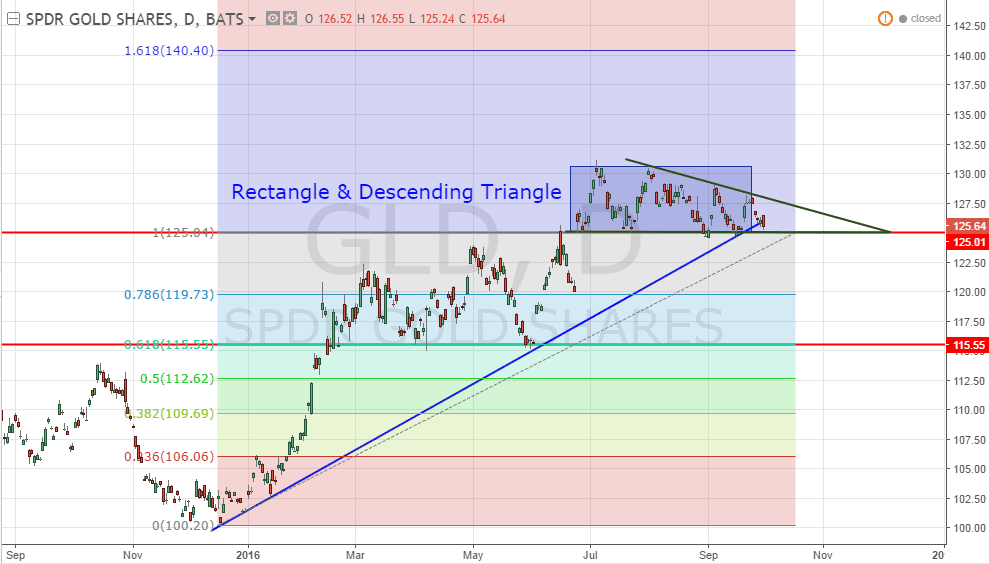
GLD (SPDR Gold Shares)
GLD looks like forming a Descending Triangle (in green). Expect GLD to trade in a range until breakout.
Next Week Economic Calendar
Key events:
- US releases ISM Manufacturing PMI on Oct 3 (Monday)
- Crude Oil Inventory on Oct 5 (Wednesday)
- Non Farm Payroll & Unemployment Rate on Oct 7 (Friday)


