
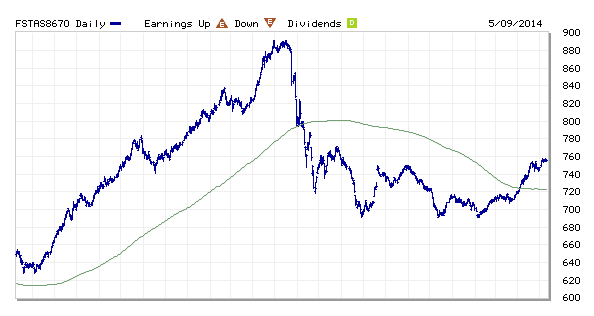
FTSE ST Real Estate Investment Trusts (FTSE ST REIT) Index changes from 731.88 to 755.37 compare to last post on Singapore REIT Fundamental Comparison Table on April 5, 2014. The index is trading above 200D SMA (moving sideway) after breaking out from a Descending Triangle. A trend reversal in making if the index find support at 200D SMA.
- Price/NAV increases from 0.9930 to 1.0022.
- Dividend Yield decreases from 6.72% to 6.61%
- Gearing Ratio decreases from 34.00% to 33.76%
- Added: Mapletree Logistic Trust.

- In general (base on quantitative analysis and technical analysis), Singapore REIT is at fair value now and the distribution yield is attractive (but with risks). Most of the Singapore REITs are trading in a consolidation range but some REITs have broken the 200D SMA resistance and started the uptrend. Finding a fundamentally strong REIT with manageable risk (using Fundamental Analysis) and buy on dip on an uptrend (using Technical Analysis) should be the accumulation strategy. Take note that NOT all Singapore REITs are investable in the long term. So, it is very important to select the right REITs and find the right entry timing.
- Find out in the next workshop on “How to pick Singapore REIT for Dividend Investing” to learn how to do Quantitative, Qualitative Analysis and Risk Assessment Plus Identify the Trend on Singapore REITs to apply this accumulation strategy for Singapore REIT.
- I have created a Closed Group Facebook page for Participants of my REIT workshop to share my REIT analysis files and keep an archive of analysts report. Ex-students who wish to join the facebook page please drop me an email marubozu@mystocksinvesting.com. State your name and your course date so that I can add you into the page.
