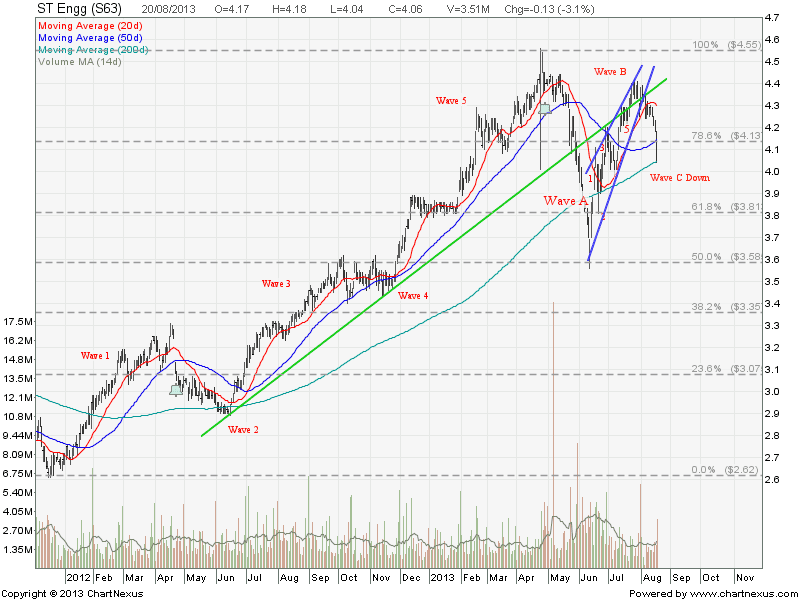
ST Engineering broke down from the Rising Wedge and is currently testing 200D SMA. If this 200D SMA support is broken, there will be a huge down side to go base on Elliott Wave pattern (Wave C Down). Sit tight!
See last analysis on ST Engineering.
Key Statistics for STE
| Current P/E Ratio (ttm) | 21.5728 |
|---|---|
| Estimated P/E(12/2013) | 20.1990 |
| Relative P/E vs. FSSTI | 1.6640 |
| Earnings Per Share (SGD) (ttm) | 0.1882 |
| Est. EPS (SGD) (12/2013) | 0.2010 |
| Est. PEG Ratio | 2.4336 |
| Market Cap (M SGD) | 12,606.04 |
| Shares Outstanding (M) | 3,104.94 |
| 30 Day Average Volume | 1,646,100 |
| Price/Book (mrq) | 6.8085 |
| Price/Sale (ttm) | 1.9539 |
| Dividend Indicated Gross Yield | 1.72% |
| Cash Dividend (SGD) | 0.0300 |
| Last Dividend | 08/21/2013 |
| 5 Year Dividend Growth | -0.09% |
| Next Earnings Announcement | 11/07/2013 |

