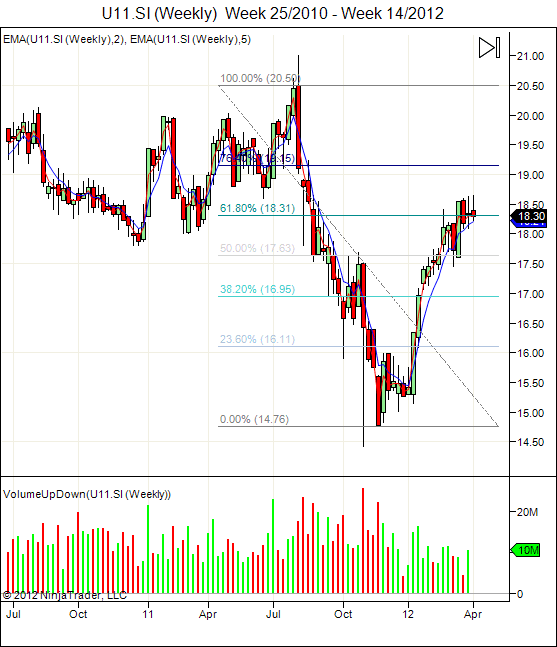
UOB Bank is forming a Rising Wedge, a Trend Reversal Pattern on the daily chart. The wedge support is at around $18.20 which is also the 20D SMA. Weekly chart show UOB is having difficulty to break the 61.8% Fibonacci Retracement Resistance. Although 2/5W EMA still showing uptrend in weekly chart but potential trend reversal Rising Wedge in the daily chart may alert the short sellers. Watch out for a Bearish Convergence signal to confirm the trend reversal.
XD Date: May 7, 2012


