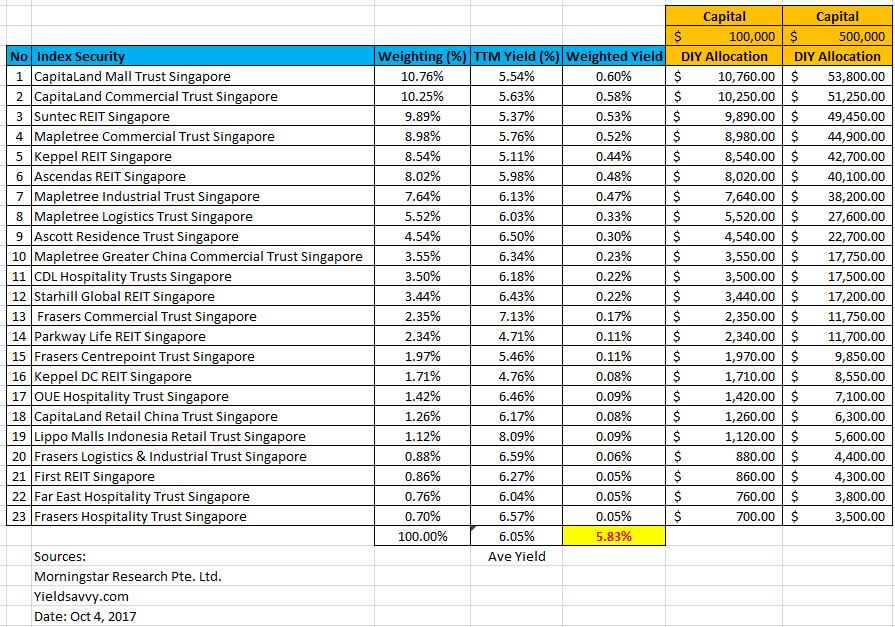
Jocelyn Goh, AFPCM
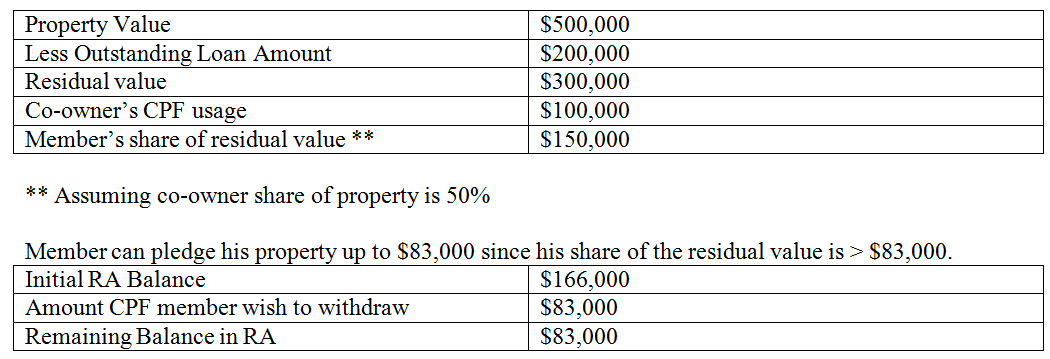
Do you know you can pledge your property to meet the minimum sum required in the Retirement Account (RA) at age 55? Anyone who owns a property can pledge up to his share of the residual value of the property. The property needs to have more than 30 years of remaining lease and must not be a 2-room flexi or lease buyback scheme flat. A maximum of $83,000 can be pledged out of the minimum sum of $166,000 (Basic Retirement Sum).

A charge will be created on the property, this is to ensure the amount pledged will be refunded when the property is sold or transferred in the future. A charge can be sufficient if it can restore your RA to the full retirement sum when you sell or transfer your property.
Property Charge is sufficient
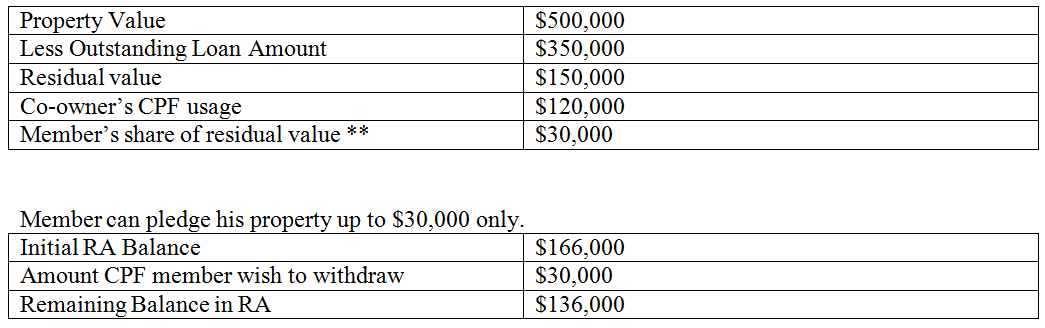
Property Charge is insufficient
Pledging your property would mean you can withdraw a bigger lump sum as age 55, once the minimum sum is met. However, you do not need to make a decision on your 55th birthday. It would be advisable to leave the extra money with CPF if you do not know what to do with it.
CPF monies are invested in Special Singapore Government Securities (SSGS) which is guaranteed by the Government. You can earn an extra 1% interest per annum on the first $60,000 in your RA. The savings in your RA are compounded year after year. So, you can let your money grow in your RA and withdraw it only when you need it, in full or partially.