Singapore REIT Fundamental Analysis Comparison Table – 1 Mar 2014
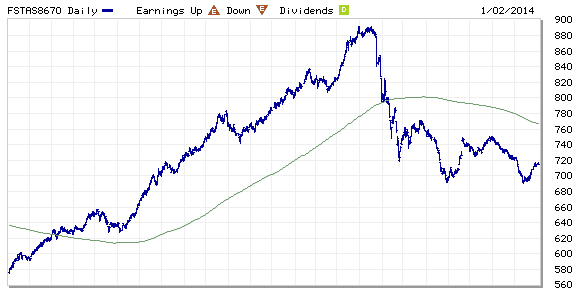
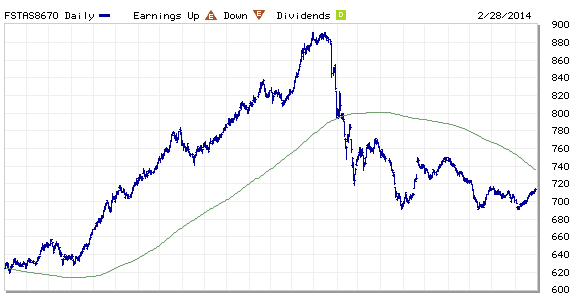
FTSE ST Real Estate Investment Trusts (FTSE ST REIT) Index changes from 696.54 to 714.18 compare to last post on Singapore REIT Fundamental Comparison Table on Feb 8, 2014. The index is trading below 200D SMA (and sloping down) and technically bearish but consolidating within a Descending Triangle. Breaking down from this Descending Triangle will trigger more selling of Singapore REITs.
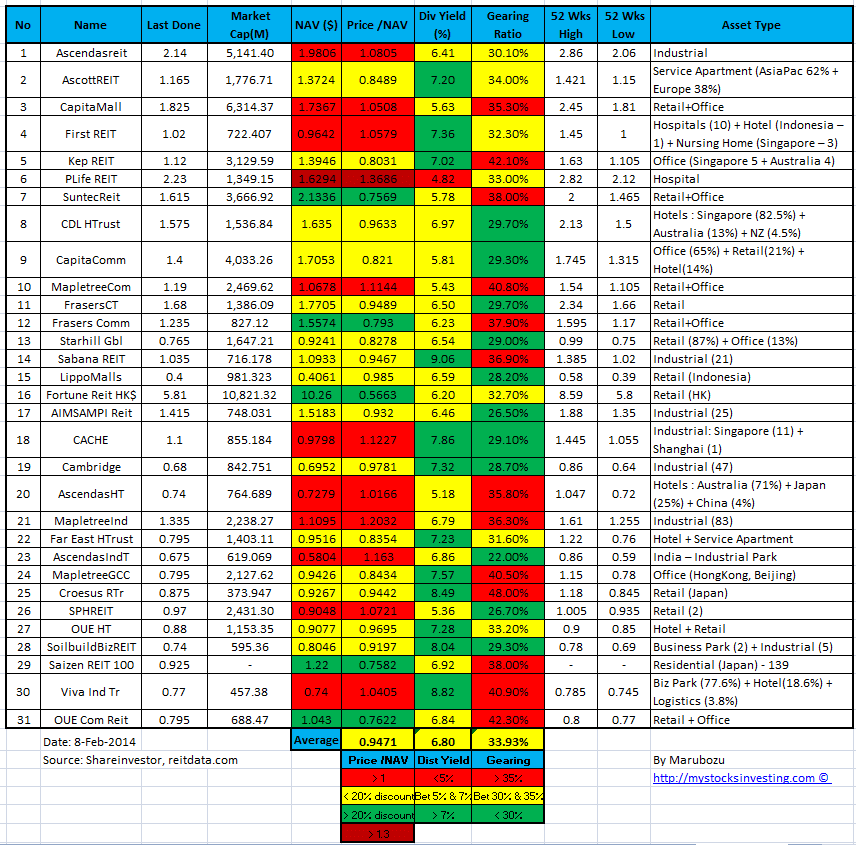
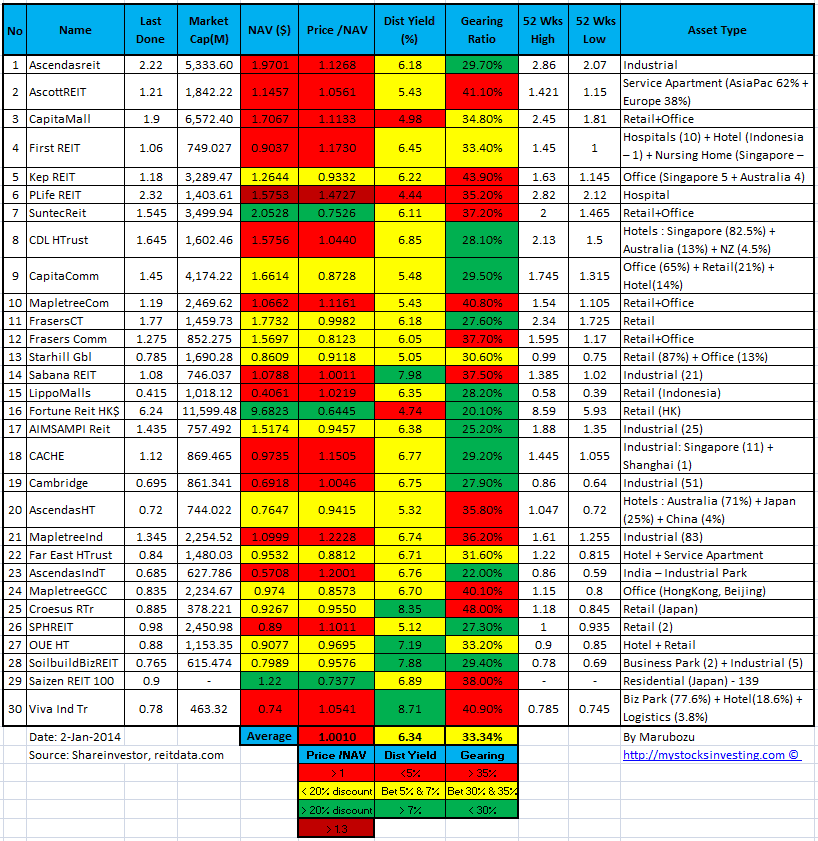
- Price/NAV decreases from 0.9471 to 0.9687.
- Dividend Yield increases from 6.80% to 6.84%.
- Gearing Ratio increases from 33.93% to 34.00%.
- In general, most Singapore REIT is slightly under value now and the distribution yield is attractive (but with risks). Most of the Singapore REITs are trading in a consolidation range and seems like waiting for the next big move base on technical analysis and chart pattern.
- There are two negative points to take note when investing in Singapore REITs:
- Overall sentiment is negative for Singapore REITs. This can be seen from the the FTSE ST Real Estate Investment Trust Index and FTSE ST Real Estate Index.
- The uncertainty in term of interest hike in near future remains high as Federal has started the QE tapering. Any hike in interest will affect the distribution income (reduction), NAV (value drops) and also the gearing ratio (increase) of the REIT. All of these will weaken the fundamental of the REIT and affect the REIT share price.
- However there are some REITs in Singapore have been managing their debt maturity profile pretty well and have minimum impact if there is an increase in interest rate. The DPU should not be affected much and the risk of DPU reduction is minimal. The key thing here is how to find out those “Gem” by applying the right method to analyse the Risks. Join the next workshop on “How to pick Singapore REIT for Dividend Investing” to learn how to do Quantitative, Qualitative Analysis and Risk Assessment Plus Identify the Trend on Singapore REITs so not to miss out any opportunity to pick up “Low Risk REITs with Decent Dividend Yield”.

.