Singapore Healthcare REITs: First REIT vs Parkway Life REIT
  • Post author:

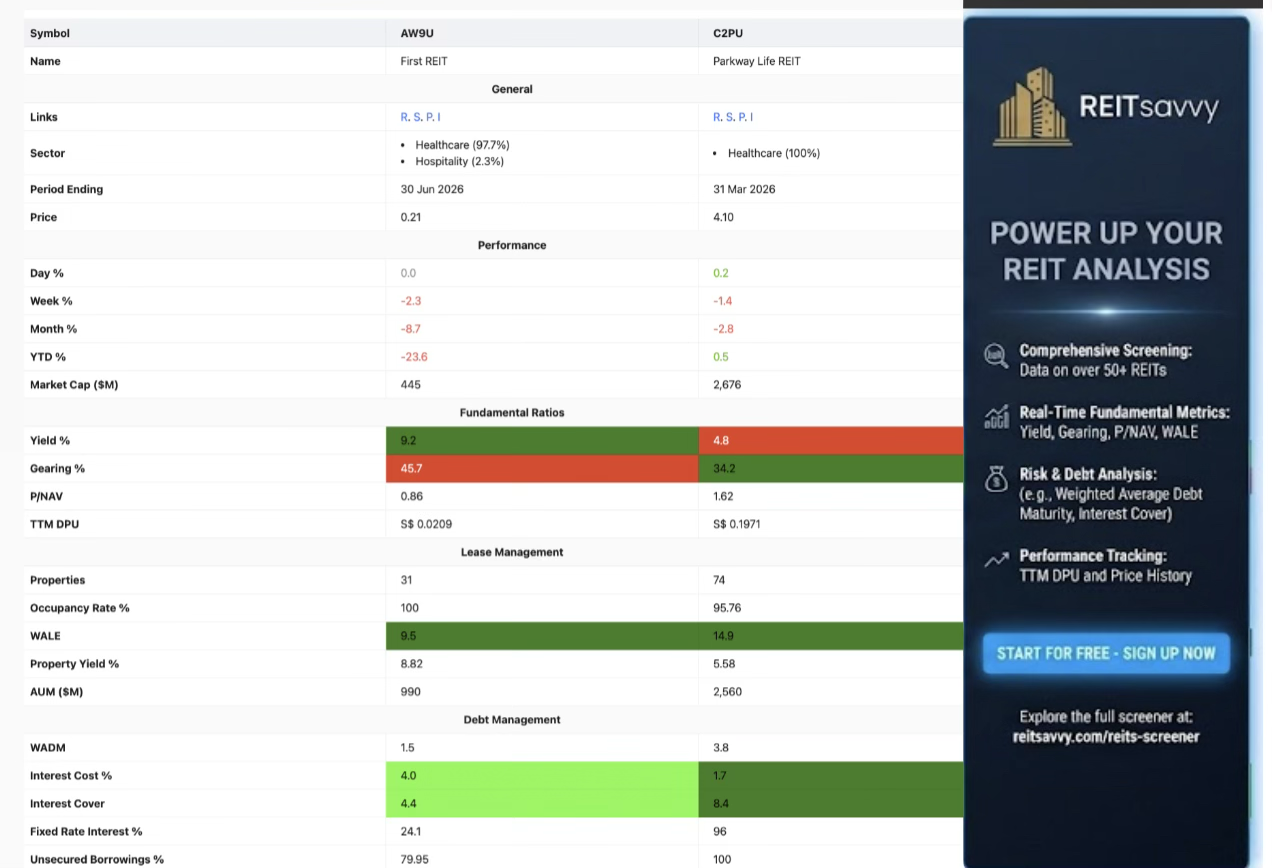
Singapore’s healthcare REIT segment provides investors with exposure to healthcare-related properties, with both First REIT and Parkway Life REIT showing a strong focus on the healthcare sector. Based on the comparison data, First REIT derives 97.7% of its portfolio from healthcare, with the remaining 2.3% in hospitality, while Parkway Life REIT has 100% healthcare exposure.

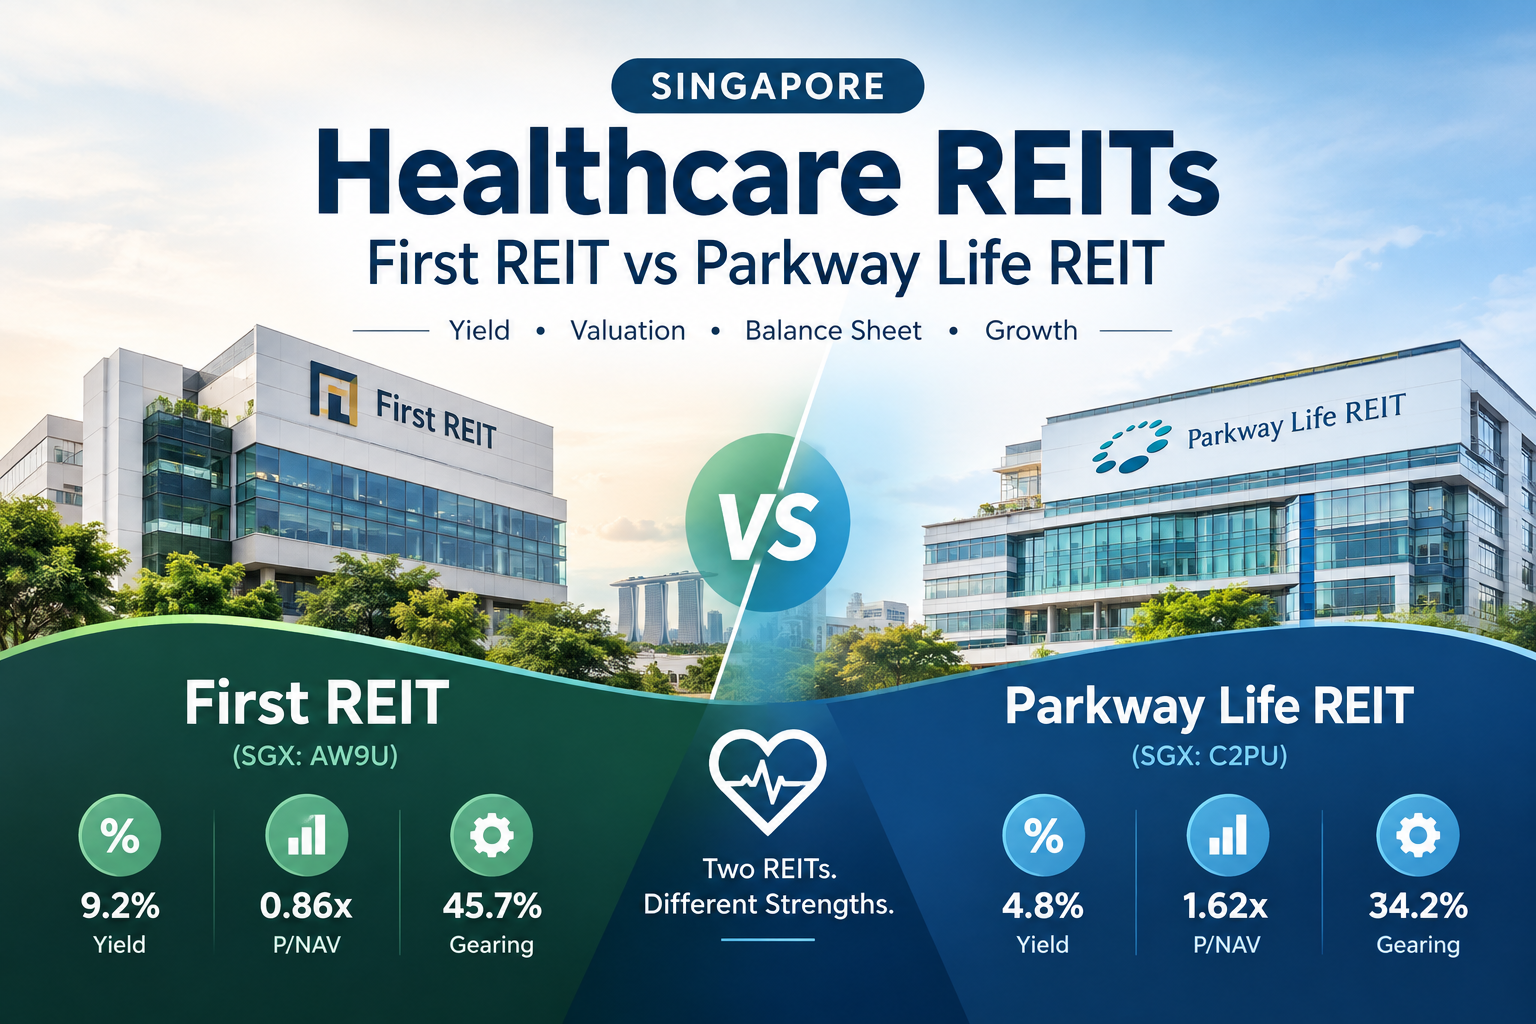
However, the two REITs present very different investment profiles. First REIT offers a significantly higher yield and trades below NAV, while Parkway Life REIT has lower gearing and stronger year-to-date performance but trades at a substantial premium to NAV. This creates a clear contrast between a higher-yield, value-oriented profile and a more conservatively valued healthcare REIT.

1. First REIT (SGX: AW9U) — The High-Yield Value Play

First REIT stands out for its combination of a high distribution yield and discounted valuation. At 9.2% yield and 0.86x P/NAV, it offers considerably more income and a lower valuation compared with Parkway Life REIT.

• Tailwinds:

  • Attractive Distribution Yield:First REIT’s 9.2% yield is almost twice Parkway Life REIT’s 4.8%. This makes it particularly attractive for investors who prioritise income generation.
  • Discount to NAV:With a P/NAV of 0.86, First REIT trades below its net asset value. This provides a potentially attractive valuation compared with Parkway Life REIT, which trades at 1.62x P/NAV.
  • Strong Healthcare Focus:Healthcare accounts for 97.7% of First REIT’s portfolio, meaning the REIT remains heavily positioned within the healthcare sector.
  • Positive Exposure to Healthcare While Maintaining Some Diversification:The remaining 2.3% hospitality exposure provides a small degree of diversification beyond healthcare, although the portfolio remains predominantly healthcare-focused.

• Headwinds:

  • High Gearing:First REIT’s gearing of 45.7% is considerably higher than Parkway Life REIT’s 34.2%. This indicates a more highly leveraged balance sheet and potentially less financial flexibility.
  • Weak Year-to-Date Performance:First REIT recorded a -23.6% YTD performance, significantly underperforming Parkway Life REIT’s +0.5%. This suggests that investor sentiment toward First REIT has been considerably weaker over the period shown.
  • Significant Valuation Discount:Although the 0.86x P/NAV can be viewed as a value opportunity, the discount also indicates that investors are placing a lower valuation on First REIT’s assets compared with Parkway Life REIT.
  • Lower Market Capitalisation:With a market capitalisation of S$445 million, First REIT is substantially smaller than Parkway Life REIT at S$2.676 billion. This gives the two REITs very different market profiles, with First REIT being the smaller counter.

2. Parkway Life REIT (SGX: C2PU) — The Lower-Gearing Healthcare Play

Parkway Life REIT presents a more conservative profile compared with First REIT. The REIT has 100% healthcare exposure, lower gearing of 34.2%, and positive YTD performance of 0.5%. However, investors are paying a substantial premium for this profile, with a P/NAV of 1.62x and a lower yield of 4.8%.

• Tailwinds:

  • 100% Healthcare Exposure:Unlike First REIT, Parkway Life REIT’s portfolio is 100% healthcare, providing investors with direct exposure to the healthcare sector.
  • Lower Gearing:Parkway Life REIT’s gearing of 34.2% is significantly lower than First REIT’s 45.7%. This provides a comparatively stronger balance-sheet position based on the data shown.
  • Positive YTD Performance:Parkway Life REIT recorded a +0.5% YTD performance, compared with First REIT’s -23.6%. This indicates substantially stronger share-price performance over the period shown.
  • Larger Market Capitalisation:At S$2.676 billion, Parkway Life REIT has a market capitalisation more than six times that of First REIT. Its larger size distinguishes it from First REIT within the healthcare REIT comparison.

• Headwinds:

  • Lower Distribution Yield:Parkway Life REIT’s 4.8% yield is significantly lower than First REIT’s 9.2%. For investors focused primarily on income, this makes Parkway Life REIT less attractive on headline yield.
  • Premium to NAV:With a P/NAV of 1.62x, Parkway Life REIT trades significantly above its NAV. This contrasts sharply with First REIT’s 0.86x and means investors are paying a substantial premium for Parkway Life REIT.
  • Less Attractive Valuation Compared with First REIT:While Parkway Life REIT has stronger YTD performance and lower gearing, its higher P/NAV and lower yield make it less compelling for investors specifically seeking discounted valuations and higher income.
  • Recent Performance Remains Modest:Although Parkway Life REIT outperformed First REIT on a YTD basis, its displayed YTD gain of 0.5% remains relatively modest compared with the significant valuation premium reflected in its 1.62x P/NAV.
POWER UP YOUR REIT ANALYSIS

  • Comprehensive Screening: Data on over 30+ Singapore REITs
  • Real-Time Fundamental Metrics: Yield, Gearing, P/NAV, WALE
  • Risk & Debt Analysis: (e.g., Weighted Average Debt Maturity, Interest Cover)
  • Performance Tracking: TTM DPU and Price History

SIGN UP NOW and Explore the full screener at: reitsavvy.com/reits-screener

Kenny Loh is a distinguished Wealth Advisory Director with a specialization in holistic investment planning and estate management. He excels in assisting clients to grow their investment capital and establish passive income streams for retirement. Kenny also facilitates tax-efficient portfolio transfers to beneficiaries, ensuring tax-efficient capital appreciation through risk mitigation approaches and optimized wealth transfer through strategic asset structuring.

In addition to his advisory role, Kenny is an esteemed SGX Academy trainer specializing in S-REIT investing and regularly shares his insights on MoneyFM 89.3. He holds the titles of Certified Estate & Legacy Planning Consultant and CERTIFIED FINANCIAL PLANNER (CFP).

With over a decade of experience in holistic estate planning, Kenny employs a unique “3-in-1 Will, LPA, and Standby Trust” solution to address clients’ social considerations, legal obligations, emotional needs, and family harmony. He holds double master’s degrees in Business Administration and Electrical Engineering, and is an Associate Estate Planning Practitioner (AEPP), a designation jointly awarded by The Society of Will Writers & Estate Planning Practitioners (SWWEPP) of the United Kingdom and Estate Planning Practitioner Limited (EPPL), the accreditation body for Asia.

You can join his Telegram channel #REITirement – SREIT Singapore REIT Market Update and Retirement related news. https://t.me/REITirement

Continue ReadingSingapore Healthcare REITs: First REIT vs Parkway Life REIT

Will Hospitality REITs take off? An overview of Hospitality REITs

  • Post author:

Are Singapore Hospitality REITs a good buy today? The IATA expects that personal and leisure travel will return from 2nd half of 2021, as travel bubbles form and vaccination continues. In this article we’ll be covering the 5 Hospitality REITs in Singapore (excl Eagle Hospitality Trust) in greater detail, comparing their portfolio information, financial ratios, etc. The 5 REITs are namely ARA Hospitality Trust, Ascott Residence Trust, CDL Hospitality Trust, Far East Hospitality Trust and Frasers Hospitality Trust.

REIT Portfolio Overview

ARA Hospitality Trust has a 100% US portfolio consisting of 41 upscale hotels across 22 states, which consists of Hyatt-branded and Mariott-branded hotels. It has a total portfolio valuation of approximately US$700 million.


The largest of the 5 REITs listed here, Ascott Residence Trust has a total portfolio valuation of about S$7.2 billion. It is the most globally diversified REIT in this list, with 86 properties in 15 countries, including China, Japan, Australia, France, Germany and the United States. Its properties in Singapore comprises 16% of the total portfolio valuation with 5 properties.


CDL Hospitality Trusts has 18 properties across 8 countries including Japan, United Kingdom, New Zealand, the Maldives, Australia, Germany and Italy. It has a portfolio valuation of S$2.597 billion. Its properties in Singapore comprises 66% of the total portfolio valuation with 7 properties.


Far East Hospitality Trust is the only REIT in this list with all its 9 Hotels and 4 Serviced Residences in Singapore. It has 3 in-house brands, namely Quincy, Village Hotels and Oasia Hotel, and has a total portfolio valuation of S$2.65 billion (which is similar to that of CDL Hospitality Trusts).


Frasers Hospitality Trust has 15 properties across Australia, Singapore, Japan, United Kingdom, Malaysia and Germany. It has a total portfolio valuation of S$2.25 billion. Its properties in Singapore comprises 35% of the total portfolio valuation with 2 properties.

Portfolio Distribution (Singapore)

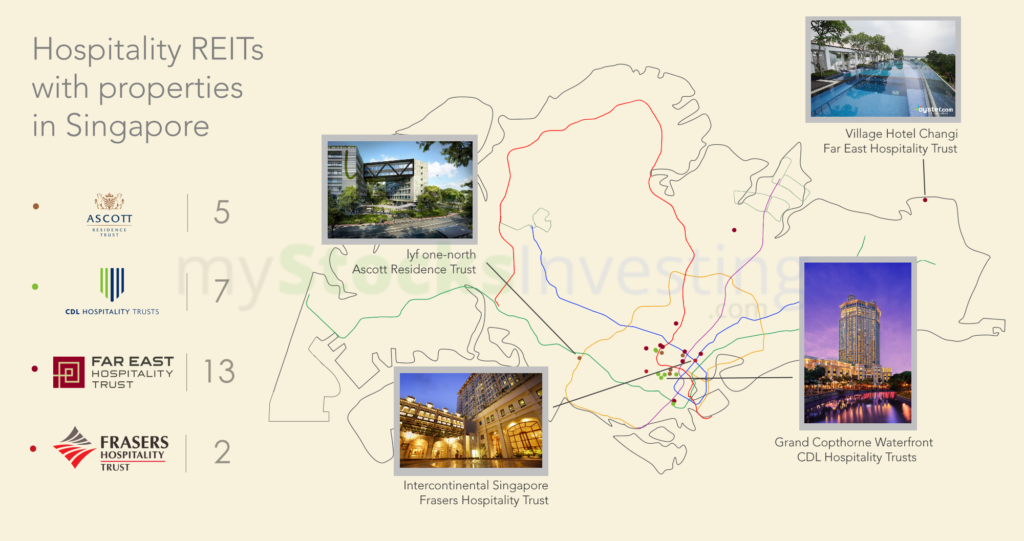
Geographical distribution of the Hospitality REITs properties (in Singapore)

Some observations that can be drawn out include:

  • Most hospitality properties are located in and around the Central area.
  • Only 3 properties are located outside of Singapore’s Central. They are:
    • lyf one-north, a co-living property in development, with estimated completion in 2021 (Ascott Trust)
    • Village Residence Hougang and Village Hotel Changi (Far East Hospitality Trust)

Portfolio Distribution (World)

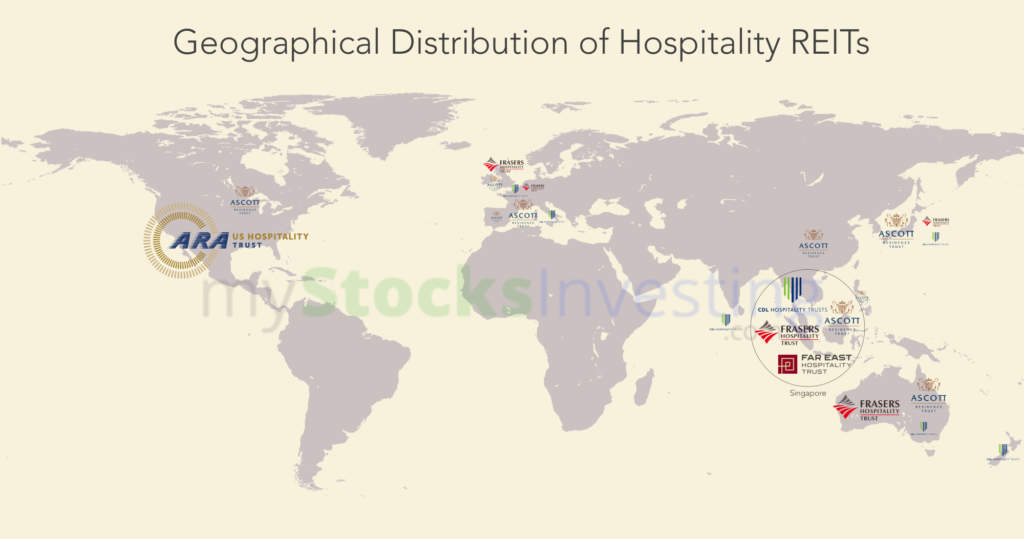
Geographical distribution of the Hospitality REITs properties globally. The size of the logo loosely reflects the percentage of the portfolio’s presence in the area.

One observation that can be drawn out is that Ascott Residence Trust, Frasers Hospitality Trust and CDL Hospitality Trusts are quite geographically diversified. Below, we will be comparing the REITs in-depth, using the latest values taken from the StocksCafe REIT screener, which values are taken from each REIT’s Q4 2020 business updates.

Fundamental Ratios

Funamental Ratio comparison between the 5 REITs. Information taken from the StocksCafe REIT screener. Values taken on 8th April 2021.

The above table shows the corresponding fundamental ratios of the 5 REITs. Some observations that can be made are shown below:

  • Yield (ttm): As expected, due to the Covid-19 pandemic stemming almost all international travel, yield (ttm) for all 5 hospitality REITs are low, at below 4% for all REITs.
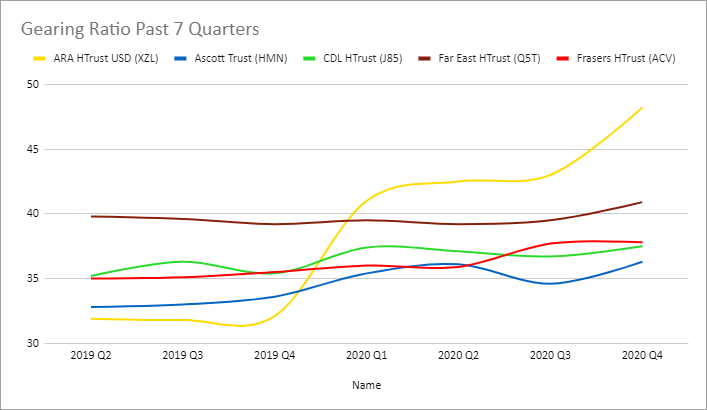
  • Gearing: The gearing ratios for all 5 hospitality REITs have generally increased in the past 4 quarters largely due to the reduced revenue caused by the global pandemic. The gearing ratio trends for all 5 REITs are shown below for reference.

  • Price/NAV: All 5 Hospitality REITs are relatively undervalued, with the exception of Ascott Trust and CDL Hospitality Trusts which are almost at book value with P/NAV values of about 0.95-0.98.
  • NAV: Net Asset Value of each REIT
  • TTM DPU: ARA Hospitality Trust has not had any dividend payouts for the past 4 quarters.

Lease Management

Lease Management comparison between the 5 REITs. Information taken from the StocksCafe REIT screener. Values taken on 8th April 2021.

The above table shows the corresponding lease management values of the 5 REITs. Some observations that can be made are shown below:

  • No. of Properties: Ascott Trust is the largest with 86 properties, followed by ARA Hospitality Trust. However do note that ARAHT has the lowest total portfolio valuation, despite having the 2nd most no. of properties.
  • Occupancy Rate: N/A for Hospitality REITs, although ARAHT provided a 41% occupancy rate.
  • Weighted Average Lease Expiry (WALE): N/A for Hospitality REITs
  • Property Yield: Property Yields are low, but that is to be expected. 5 of the 8 S-REITs with the lowest Property Yield are Hospitality REITs (excl Eagle HT), shown below:

  • Property Portfolio Value: ARAHT has the lowest total portfolio value, and Ascott Trust has the highest portfolio value. The rest have portfolio values of about $2-3B.

Debt Management

Debt Management comparison between the 5 REITs. Information taken from the StocksCafe REIT screener. Values taken on 8th April 2021.

The above table shows the corresponding lease management values of the 5 REITs. Some observations that can be made are shown below:

  • Weighted Average Debt Maturity (WADM): The WADM for all 5 REITs are between 2.3 and 3 years.
  • Interest Cost/Cost of Debt: ARAHT has a higher cost of debt compared to the other REITs, at 3.4%.
  • Interest Coverage Ratio: Interest Coverage Ratio is at or below 2.4 for all 5 REITs. This is expected due to the decreased revenue.
  • Unsecured Borrowings: Most of the borrowings made by the 5 REITs are unsecured, with the exception of ARAHT, with 29.2% unsecured borrowings.

Want to invest in Singapore REITs but don’t know how to start? Or not happy with your current investment portfolio? Contact Kenny here at kennyloh@fapl.sg.

Kenny Loh is a Senior Consultant and REITs Specialist of Singapore’s top Independent Financial Advisor. He helps clients construct diversified portfolios consisting of different asset classes from REITs, Equities, Bonds, ETFs, Unit Trusts, Private Equity, Alternative Investments, Digital Assets and Fixed Maturity Funds to achieve an optimal risk adjusted return. Kenny is also a CERTIFIED FINANCIAL PLANNER, SGX Academy REIT Trainer, Certified IBF Trainer of Associate REIT Investment Advisor (ARIA) and also an invited speaker of REITs Symposium and Invest Fair. Kenny Loh also offers REIT Portfolio Advisory for a fee. Do contact him at kennyloh@fapl.sg 

Continue ReadingWill Hospitality REITs take off? An overview of Hospitality REITs

Invest in Orchard Road, Singapore, with S-REITs!

  • Post author:

Orchard Road is home to familiar names such as Takashimaya, Paragon, Plaza Singapura, 313@Somerset. But with S-REITs, you can invest in a part of Singapore’s largest retail district.

Orchard Road during the holiday season, where Christmas decorations are in full swing. Photo: visitsingapore

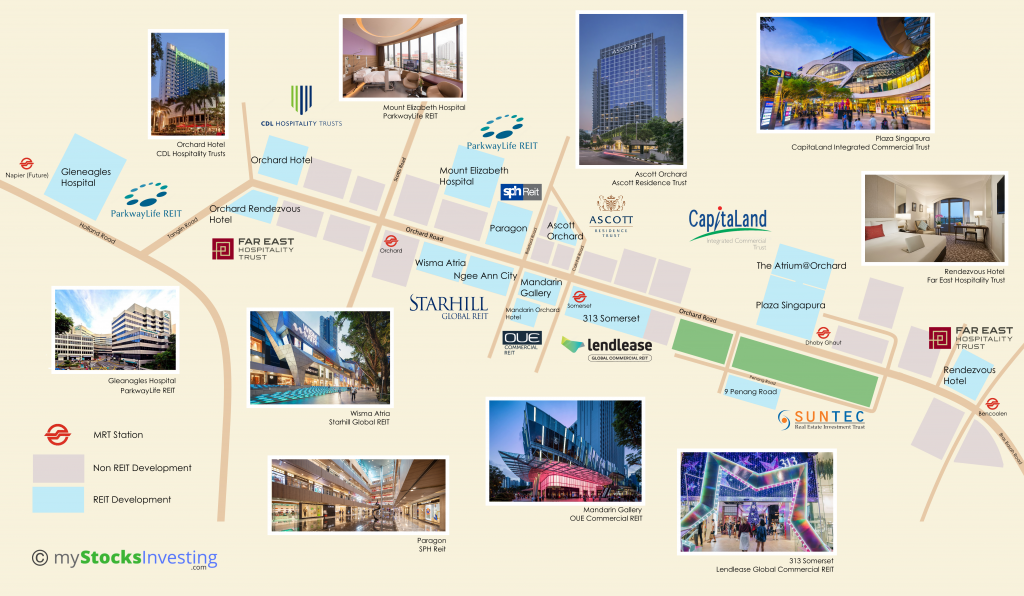
Retail is not the only REIT sector along Orchard Road. Despite mostly having a Retail REIT presence, there are also several other REIT sectors, such as hospitality and office REITs in the vicinity. Below are some of the REITs found in Orchard Road, with a handy diagram on where they are located within the shopping district. Property valuation figures are accessed via the REIT’s website as of 5th Februrary 2021.


Retail/Integrated Developments


Located next to Dhoby Ghaut MRT, Capitaland Integrated Commercial Trust, Singapore’s largest REIT by market capitalisation, has portfolios consisting of both The Atrium@Orchard and Plaza Singapura along Orchard Road. With large tenants such as Spotlight and Golden Village, both properties have a total property valuation of S$2.04 billion.


Starhill Global’s portfolio includes Wisma Atria and Ngee Ann City along Orchard Road. Both are integrated Retail and Office developments, including anchor tenants such as Takashimaya Department Store. Located next to Orchard MRT, they have a combined property valuation of S$2.062 billion.


Located right above Somerset MRT, 313@Somerset is Lendlease Global Commercial REIT’s presence in Orchard Road. 313@Somerset includes many fashion tenants such Love Bonito, ZARA, FOREVER 21, Cotton On and The Editor’s Market etc. It has a property valuation of S$1.008 billion.


OUE Commercial REIT has 2 properties along Orchard Road, namely Mandarin Gallery and Mandarin Orchard Hotel. Mandarin Gallery specialises in high-end retail with many brands such as Bathing Ape and HUGO BOSS, while Mandarin Orchard Hotel is an upscale hotel with 1,077 rooms. Both have a combined portfolio valuation of S$1.721 billion.


Paragon is a premier upscale mall, specialising in high end retail and fashion. Paragon also houses Paragon Medical, which hosts approximately 90 medical and dental specialist clinics and offices.


Office


The newest property included within this article, 9 Penang Road is a newly completed Grade A commercial building. The ten-storey development consists of two towers with office space across eight floors and retail space at the first level. It has a property valuation of S$276.0 million.


Hospitality


Located behind Knightsbridge Mall (or more easily known as the mall with Apple Store Orchard), Ascott Orchard is a serviced residence consisting of 220 suites comprising studios to two-bedroom units and penthouses. It has a property valuation of $413 million.


Far East Hospitality Trust’s portfolio consists of 2 hotels, Orchard Rendezvous Hotel at the western end and Rendezvous Hotel at the eastern end of Orchard Road. Combined, there are 686 guest rooms between the 2 hotels, with a property valuation of S$715.3 million.


Located opposite Orchard Rendezvous Hotel, Orchard Hotel has 656 guest rooms. Adjacent to Orchard Hotel is Claymore Connect, a small lifestyle mall. Both properties have a combined property valuation of S$466.0 million.


Healthcare


ParkwayLife REIT has 2 hospitals, one within Orchard (Mount Elizabeth Hospital) and one in the nearby Tanglin area (Gleneagles Hospital). Gleneagles Hospital consists of 257 beds while Mount Elizabeth Hospital has 345 beds. They have a combined total property valuation of S$1.143 billion.


Below is map which highlights the approximate location of each of the properties listed above, including several landmarks such as MRT stations. The map is not drawn to scale.


Portfolio Information is just one of the fundamentals to look at when choosing which REITs to invest in. One of which is gearing ratio (leverage ratio). Yield and lease management of REITs are also factors to consider.  For example, a property located along Orchard Road (good location) but with low occupancy rates (bad) is not necessarily good.

By investing in one of the above REITs, you will be investing in the REIT as a whole. For example, by investing in Suntec REIT, you will not just be investing in 9 Penang Road, but Suntec City Mall and Office Towers too.

In the following, using the StocksCafe REIT screener (free version), we can compare the Market Capitalisations, Yield (trailing twelve months) and Gearing Ratios for each of the REITs listed above.

Fundamental Ratios for each of the 10 REITs with properties along Orchard Road. Data taken from StocksCafe. REITs with Period Ending 31 December 2020 are updated with the latest Q4 2020 business and earning updates. Data accessed 5th February 2021.

The above table shows the 10 S-REITs, sorted by market capitalisation in descending order. For yield, the value is calculated using the trailing twelve months distribution per unit (DPU) data. Therefore it may be lower than usual due to dividend cuts brought about by the Covid-19 pandemic. Gearing is simply the percentage of total debt/total equity.

For more detailed and regularly updated information for each of the REITs, do try out and subscribe to the comprehensive StocksCafe REIT Screener. At ~$8.40 per month (current early bird promotion with a yearly subscription), get access to much more information such as occupancy rates, debt information, interest coverage ratio etc. for each REIT. You can try out the features here.

Continue ReadingInvest in Orchard Road, Singapore, with S-REITs!