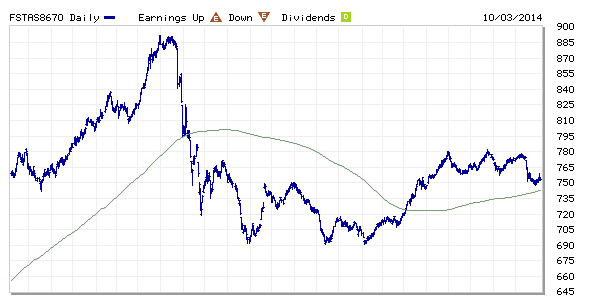
FTSE ST REIT Index (FSTAS8670) Technical Analysis
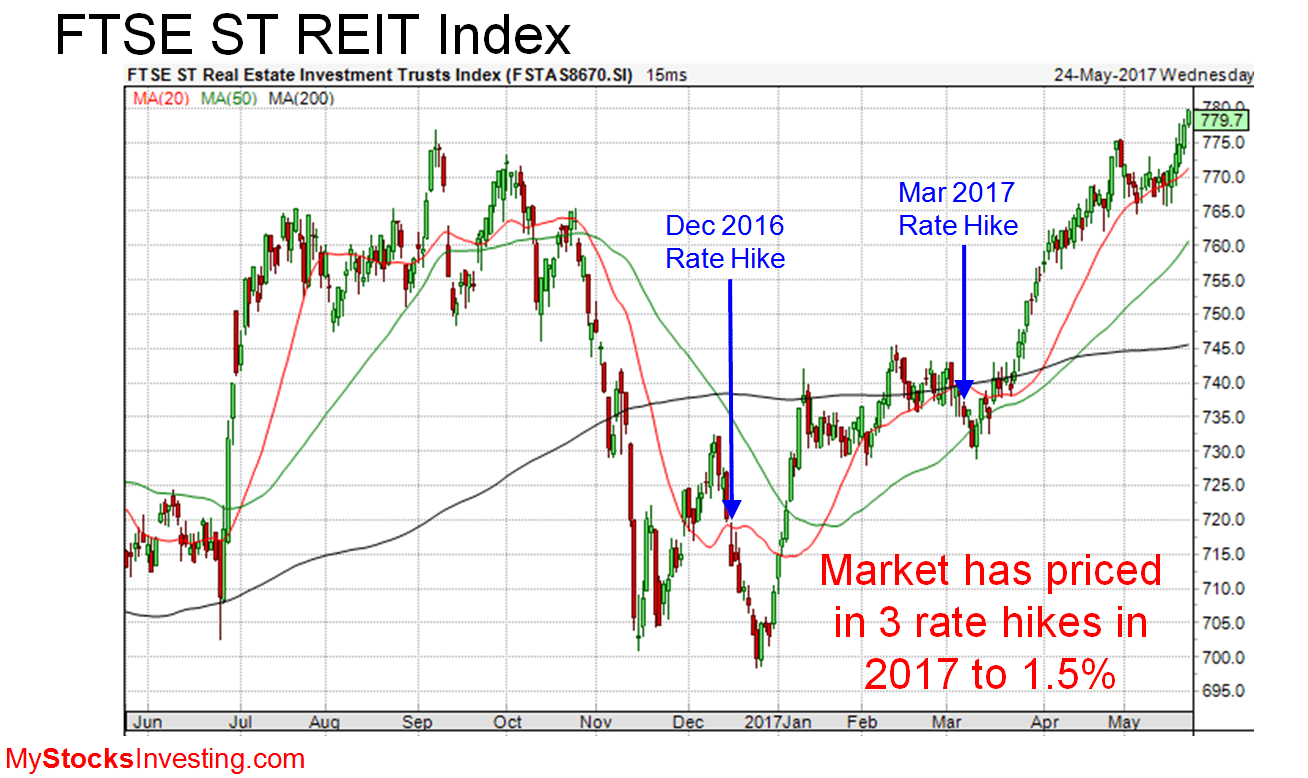
Interest Rate impact on FTSE ST REIT Index
The index has priced in the 3 rate hikes in 2017 towards 1.5% end of 2017. As long as the interest rate hike is within the expectation, there probably will not have any knee jerk effect on Singapore REITs as a whole.
.
Fed Fund Rate Forecast and Probability


.
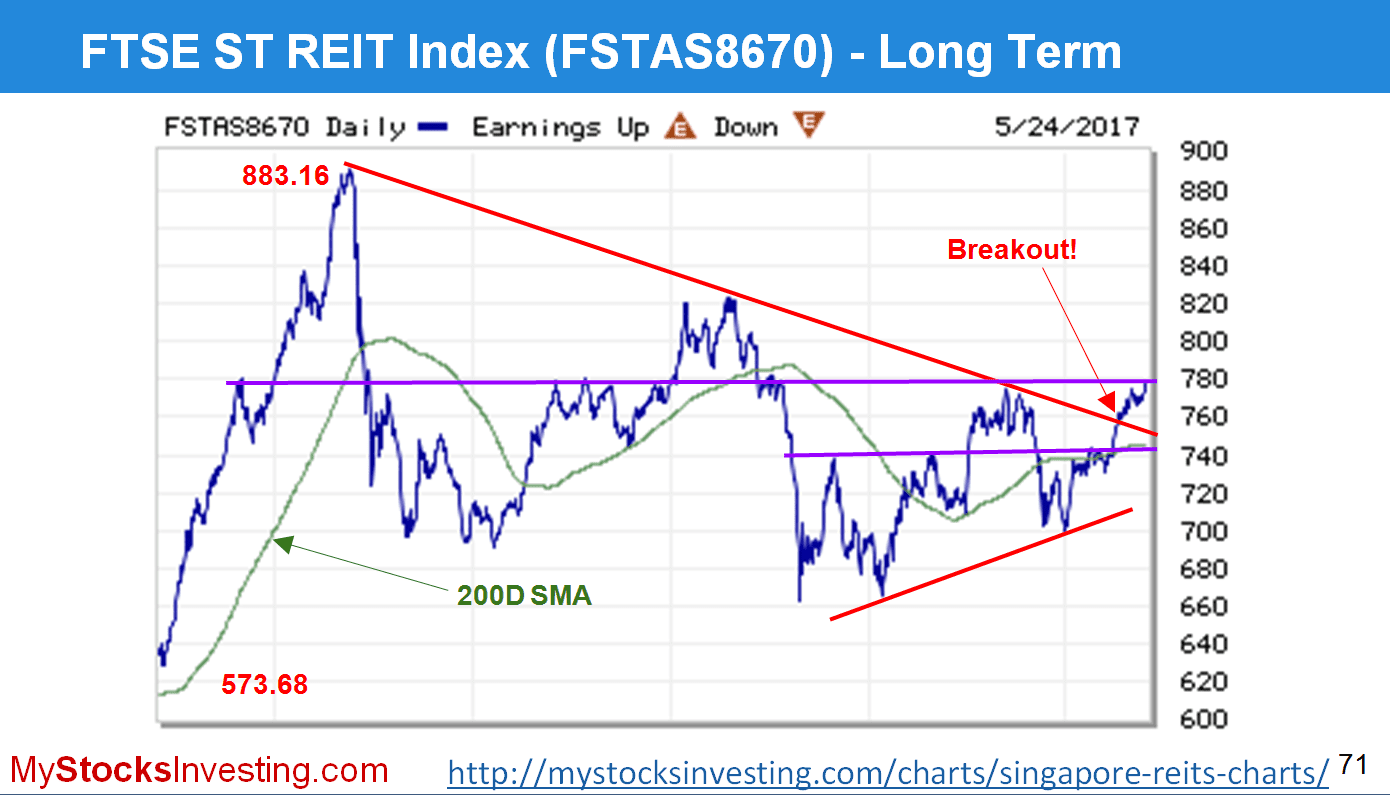
FTSE ST REIT Index is showing bullish breakout patterns Double Bottoms, Bull Flag and recently broke out from Bullish Pennant. Short term trend is bullish base on chart patterns.

.
Long term is bullish as well after broke out from a declining trend line resistance. However, the index is currently facing a tough resistance at 780 which have been a tough nut to crack under past 9 occasions.
- Immediate resistance = 780
- Next resistance = 820
- Immediate support = 740
.
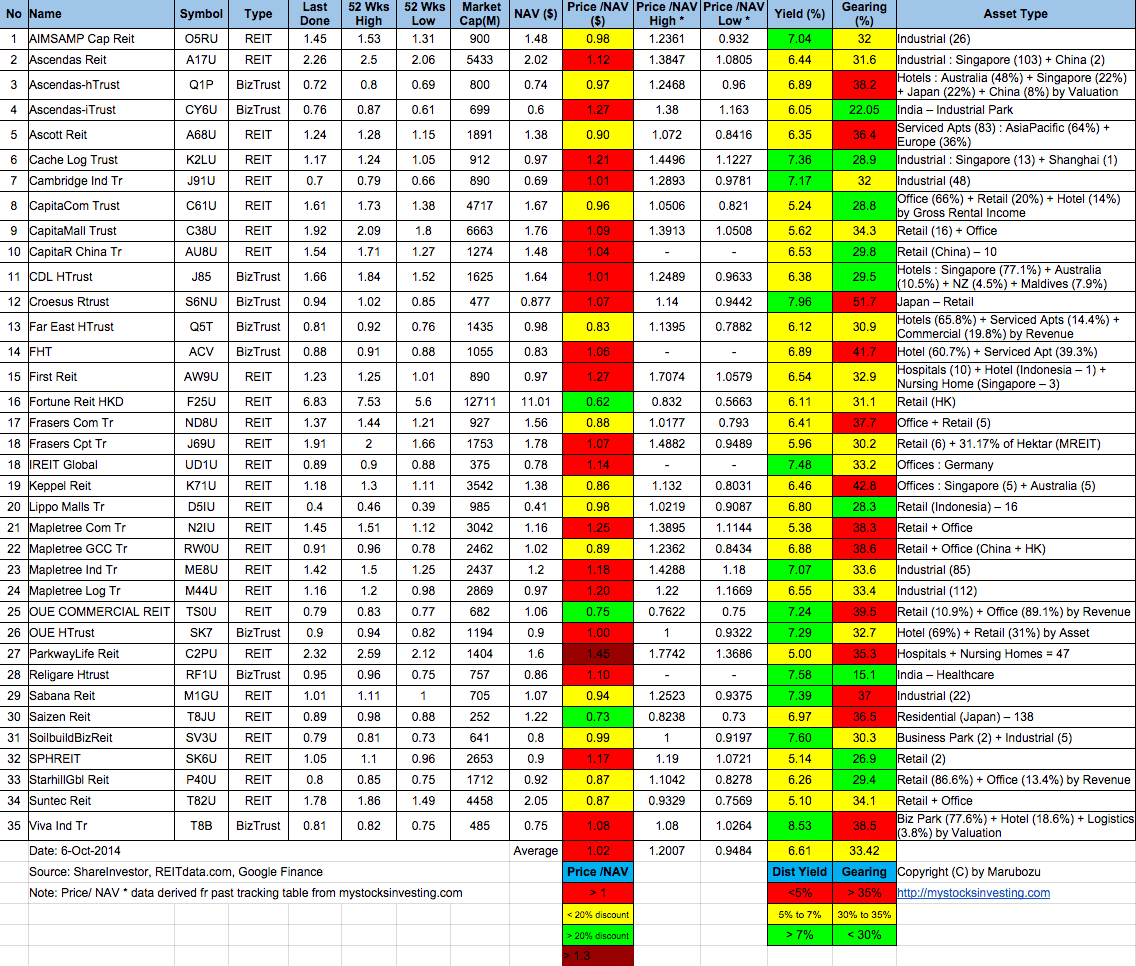
FTSE ST REIT Index Component Stocks

Original Post from https://mystocksinvesting.com
See other Singapore REITs comparison table here.