Is It Time to Invest in Singapore REIT to build up Passive Income?

  • Post author:

Debt Ceiling settled (at least for the time being), US Government re-opens, no sign of QE tapering yet, Dow Jones Industrial Index, S&P500, NASDAQ are recording historical high and still on the solid uptrend, Europe is coming out from recession, China and US GDP are doing well again….. so many good news, IS IT A GOOD TIME TO ENTER THE MARKET?

I received many inquiries regarding whether this is the right time to buy Singapore REIT. To tell you the truth: I do NOT know as I am not the fortune teller. No one can predict the direction of the stock market but it is important to understand the global economy and how those events can affect our investment plan and portfolio.

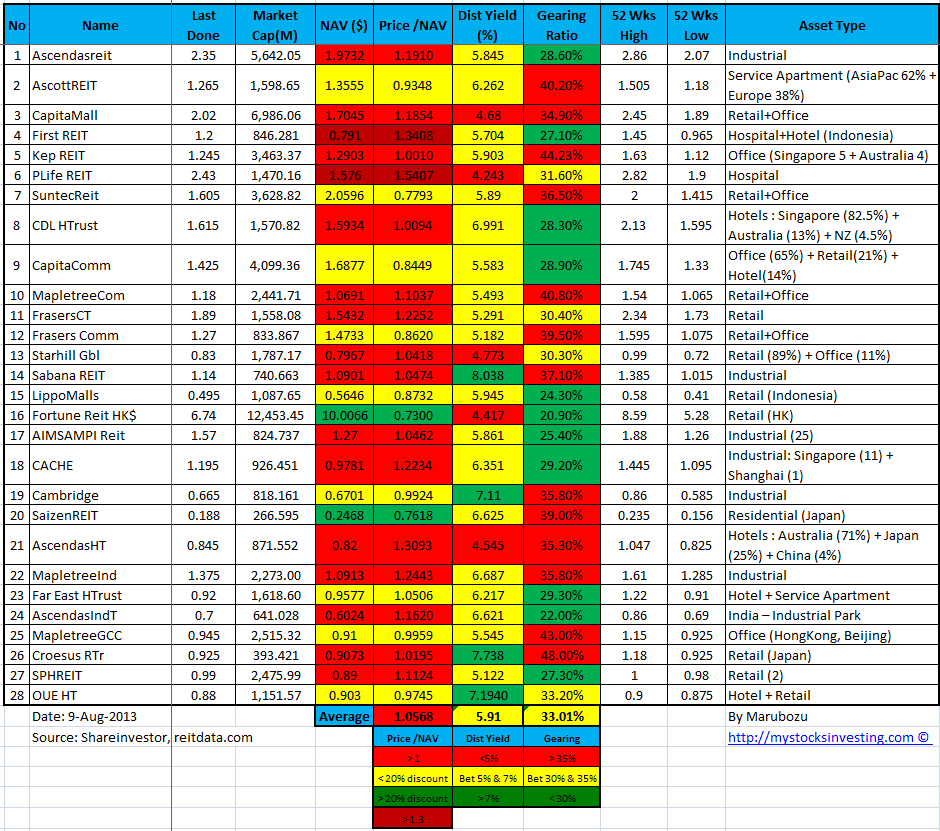
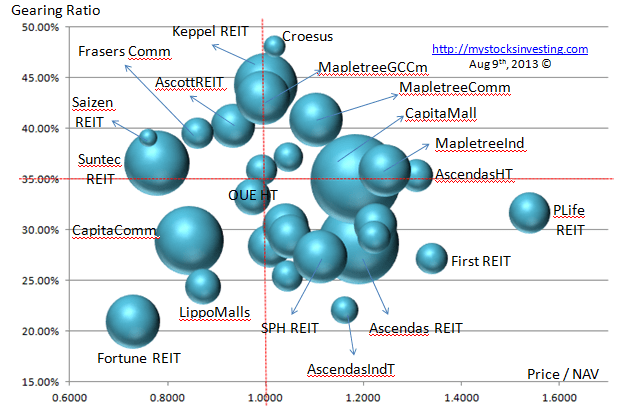
Besides looking at those Singapore REIT Fundamental data like NAV, Distribution Yield, Gearing Ratio, etc .. (See the Comparison Table for Singapore REIT here.), there are a few risks that we need to be aware as far as investing in Singapore REITs are concerned:

  • The hike of interest – The day will DEFINITELY come and the only question is when? REITs (Unit price and Distribution) will be hit because REIT has to pay more interest to the bond holders and banks due to the debt especially REITs with high gearing ratio. The hike of interest will double hit the REIT’s NAV and Distribution. 
  • REITs are sensitive to economy cycles. Any weakness in rental will affect the distribution income.
  • Currency risks for REITs which have the properties oversea.
  • REITs which high gearing may issue Rights to raise more fund to improve the working capital.

It is impossible for us to 100% understand what is happening in the world and how it will affect our REITs portfolio. However we can make better investment decision by analyse the charts using technical analysis. The charts will tell us when to invest or when to take profit / cut loss.

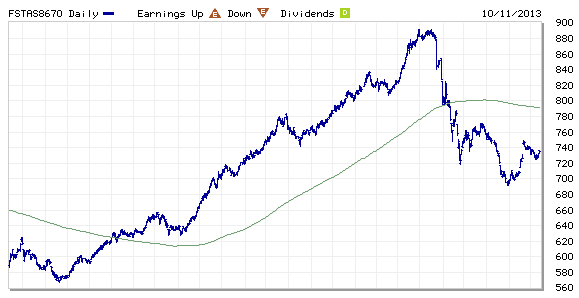
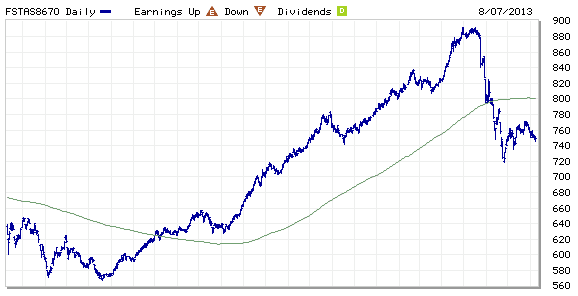
Base on the chart, FTSE ST Real Estate Investment Trust Index is still trading below 200D SMA (long term trend) but there is potential sign of reversal base on chart pattern. However, the upside potential is limited as long as the index stay below the 200D SMA.

FTSE ST REIT Index Oct18-2013


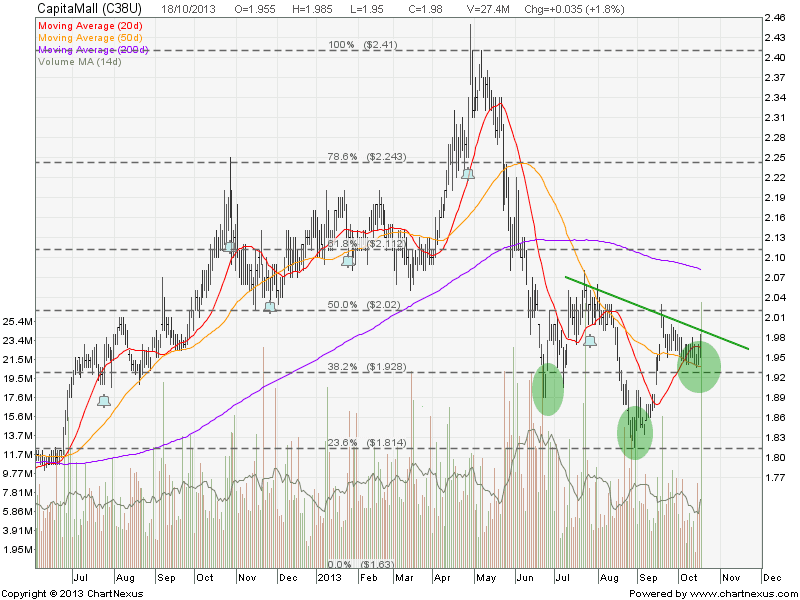
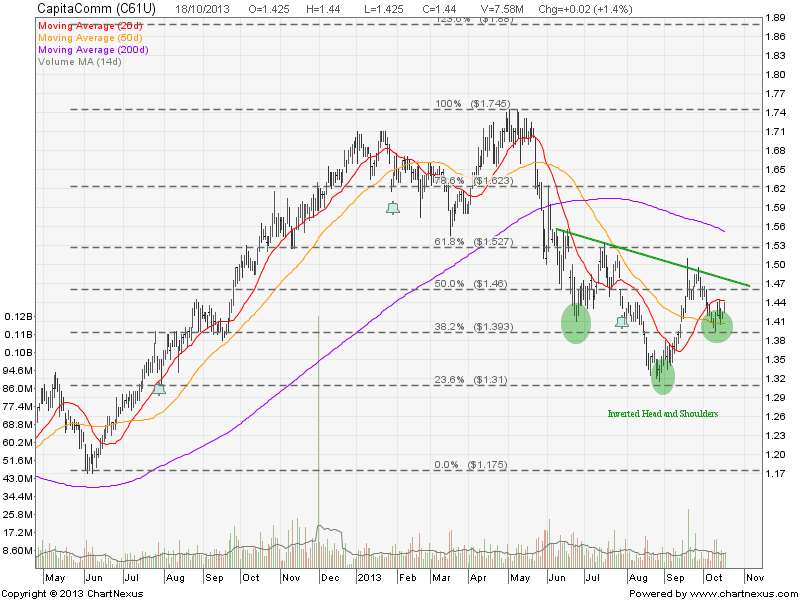
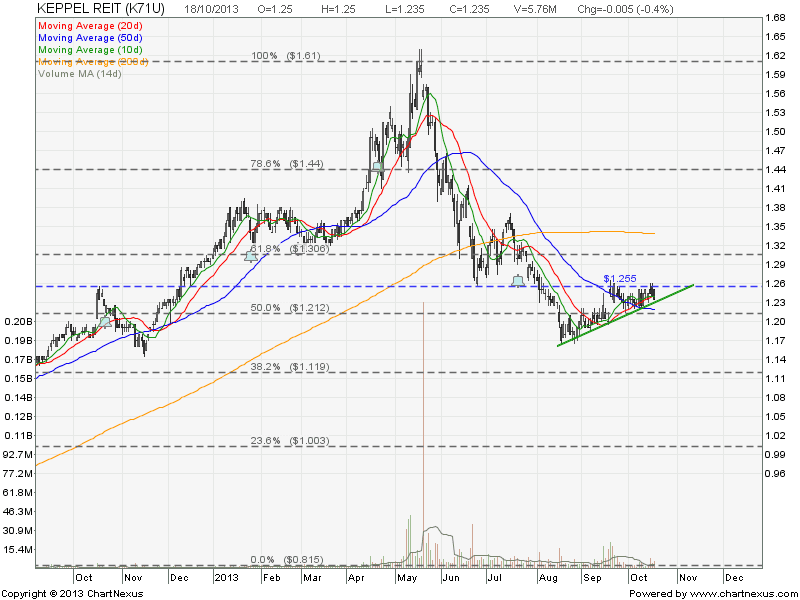
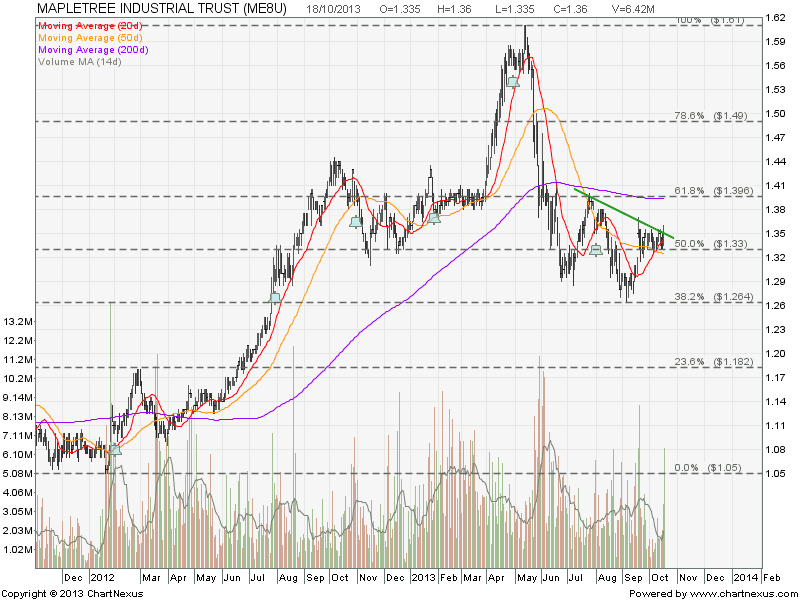
Similar chart patterns shown in the following REITs, all of them are in consolidation mode but upsides are limited.

Ascendas REIT

2013Oct20-Ascendasreit-800x600

CapitaMall

2013Oct20-CapitaMall-800x600


CapitaComm

2013Oct20-CapitaComm-800x600

Keppel REIT

Keppel REIT Oct22-2013

Mapletree Comm

Mapletreecom REIT Oct20-2013

Mapletree Ind

Mapletree Ind REIT Oct20-2013

Suntec REIT

2013Oct20 SuntecReit-800x600


I will be sharing the Singapore REIT Fundamental Analysis, Technical Analysis and how the interest rate hike will impact your REIT investment in the coming public tutorial on  “How to pick Singapore REIT for Dividend Investing” . Sign up NOW as the seats are very limited due to the classroom size.

Continue ReadingIs It Time to Invest in Singapore REIT to build up Passive Income?

Singapore REIT Fundamental Analysis Comparison Table – 12 Oct 2013

  • Post author:

FTSE ST Real Estate Investment Trusts (FTSE ST REIT) Index changes from 699.17 to 735.74 compare to last post on Singapore REIT Fundamental Comparison Table on Sept 6, 2013. The index is still trading below 200D SMA and technically bearish. However, there is sign of potential reversal if the index break the recent high of 750 as it will be forming an Inverted Head and Shoulders, a reversal chart pattern. Alternatively, the index will continue the down trend if rejected at the down trend channel resistance at about 740.

FTSE ST REIT Index Oct11-2013

Compare to last Singapore REIT comparison table:

  • Price/NAV increases from 0.9763 to 1.018.
  • Dividend Yield decreases from  6.41% to 6.23%.
  • Gearing Ratio remains the more or less the same at 33.07%.
  • In Short, some Singapore REIT become attractive in terms of valuation and distribution yield again. However technically Singapore REIT is still on down trend and the price can go even lower although fundamental looks attractive. Stock picks are important and have to be selective base on fundamental and technically analysis. The uncertainty in term of interest hike in near future remains high and this causes limited upside potential for Singapore REITs.

Singapore REIT NAV Gearing Distribution Yield Comparison Table 11-Oct-2013


Bubble Chart (Distribution Yield vs Price/NAV) – Value for Money

Singapore REIT Bubble Chart (Value) Oct11-2013


Bubble Chart (Gearing Ratio vs Price/NAV) – Risk Avoidance

Singapore REIT Bubble Chart (Risk) Oct11-2013

Compare to last Bubble Charts here.

Find out how do I conduct research on Singapore REIT, how to interpret those financial ratio in the comparison table, when is the best time to buy using simple Trend Analysis. Furthermore it is important to understand the BIGGER TREND so that your investment will not be losing money in the down trend market. Find out WHERE and HOW to read the FTSE ST Real Estate Investment Trust Index because timing is very critical in making any investment decision.  Check out my next public tutorial on  “How to pick Singapore REIT for Dividend Investing” .

Continue ReadingSingapore REIT Fundamental Analysis Comparison Table – 12 Oct 2013

Singapore REIT Fundamental Analysis Comparison Table – 9 Aug 2013 (Singapore National Day)

  • Post author:

FTSE ST Real Estate Investment Trusts (FTSE ST REIT) Index changes from 767.53 to 749.17 compare to last post on Singapore REIT Fundamental Comparison Table on July 26, 2013. The index is trading below 200D SMA and technically bearish. Looks like the index also breaks the recent rebound uptrend support line and may start Elliott Wave C (down!!).

FTSE ST REIT Index Aug9-013Compare to last SREIT comparison table:

  • Price/NAV decreases from 1.086 to 1.0568.
  • Dividend Yield increases from 5.78% to 5.91%.
  • Gearing Ratio remains the same at 33.01%.

Singapore REIT Fundamental Analysis Comparison 9-Aug-2013

Bubble Chart (Distribution Yield vs Price/NAV) – Value for Money

Singapore REIT Bubble Chart (Dist Yield vs NAV) Aug9-2013

Bubble Chart (Gearing Ratio vs Price/NAV) – Risk Avoidance

Singapore REIT Bubble Chart (Gearing vs NAV) Aug9-2013Find out how I do research on Singapore REIT, how to interpret those financial ratio in the comparison table, what opportunities can you find and what REITs should you avoid from the Bubble Charts, plus when to buy & when to sell using simple Trend Analysis. Check out my next public tutorial on  “How to pick Singapore REIT for Dividend Investing” .

Continue ReadingSingapore REIT Fundamental Analysis Comparison Table – 9 Aug 2013 (Singapore National Day)