Singapore REIT Bubble Charts Dec 2015

  • Post author:

Bubble chart derived from Dec 6 2015 Singapore REITs Fundamental Comparison Table. Compare to previous Singapore REIT Bubble Chart, Singapore REIT sector yield is quite attractive at the moment.

These Bubble Charts are used to show the “relative” position compare to other Singapore REITs.

Two visual bubble charts to pick and avoid:

  1. Undervalue Singapore REITs with High Distribution Yield (Value Pick)
  2. Overvalue Singapore REITs with High Gearing Ratio (Risk Avoidance)

The Singapore REIT Bubble charts are best used to visually Short List Singapore REIT only.

Singapore REIT Bubble Chart (Value) Dec8-2015Singapore REIT Bubble Chart (Risk) Dec8-2015

Find out How to Select Singapore REIT using Bubble Charts for Safe Dividend Investing.

Continue ReadingSingapore REIT Bubble Charts Dec 2015

Singapore REIT Fundamental Analysis Comparison Table – 6 December 2015

  • Post author:

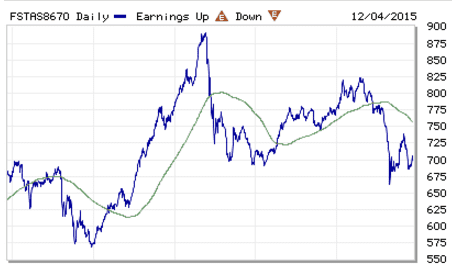
FTSE ST Real Estate Investment Trusts (FTSE ST REIT Index) decreases from 722.93 to 699.39 (-3.3%) compare to last post on Singapore REIT Fundamental Comparison Table on Nov 1, 2015. The index looks like consolidating in a Symmetrical Triangle. The long term trend remains down as the index is trading below 200D SMA which is also sloping down. Keep a close eyes on this FTST ST REIT Index if US Fed announces the Interest Hike this month. Singapore REIT market will face another round of sell off if the recent support about 650 is broken.

FTSE ST REIT Index Dec6-2015

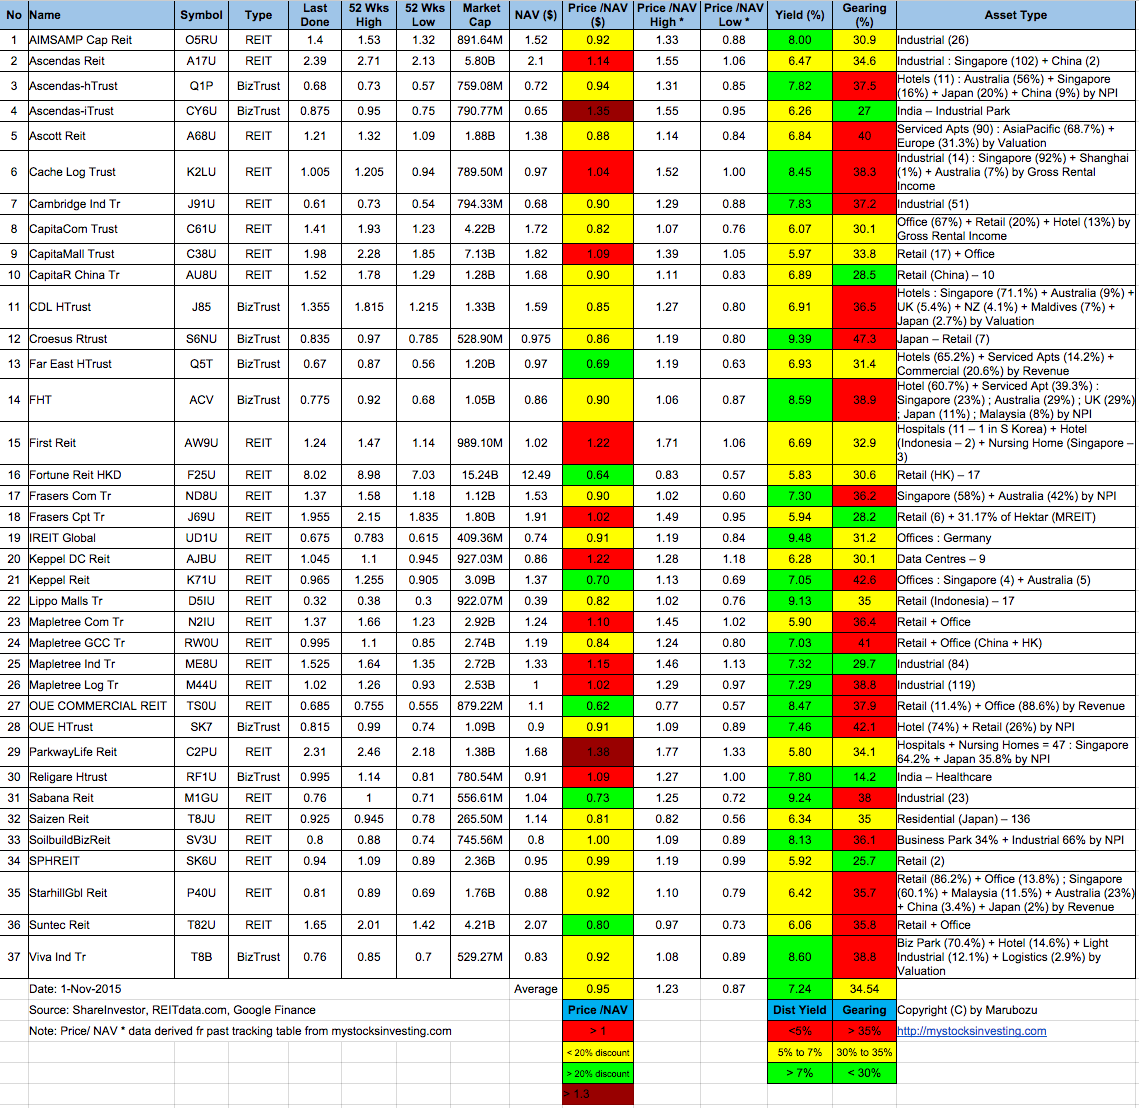
  • Price/NAV decreases from 0.95 to 0.93  (Singapore Overall REIT sector is under value now)
  • Distribution Yield increases from 7.24% to 7.42% (take note that this is lagging number). More than half of Singapore REITs (23 out of 37) have Distribution Yield > 7%. Current yield is attractive but dangerous to make investing decision purely base on the yield. Past performance does NOT equal to future performance.
  • Gearing Ratio increases from 34.54% to 34.82%.  20 out of 37 have Gearing Ratio more than 35%.
  • Most overvalue is Parkway Life (Price/NAV = 1.36),  followed by Ascendas iTrust (Price/NAV = 1.32).
  • Most undervalue (base on NAV) is Fortune REIT (Price/NAV = 0.63), followed by Far East HTrust (Price/NAV = 0.66).
  • Higher Distribution Yield is Croesus RTrust (10.38%), followed by Lippo Malls Indonesia Retail Trust (10.10%)
  • Highest Gearing Ratio is Croesus Retail Trust (47.3%) followed by iREIT Global (43.4%)
  • BHG Retail REIT IPO Prospectus.

Singapore-REIT-Fundamental-Analysis-and-Comparison-Table-6-Dec-2015

Disclaimer: The above table is best used for “screening and shortlisting only”. It is NOT for investing (Buy / Sell) decision. To learn how to use the table and make investing decision, Sign up next REIT Investing Seminar here to learn how to choose a fundamentally strong REIT for long term investing for passive income generation.

Singapore Interest RateDec6-2015 SIBOR Dec6-2015

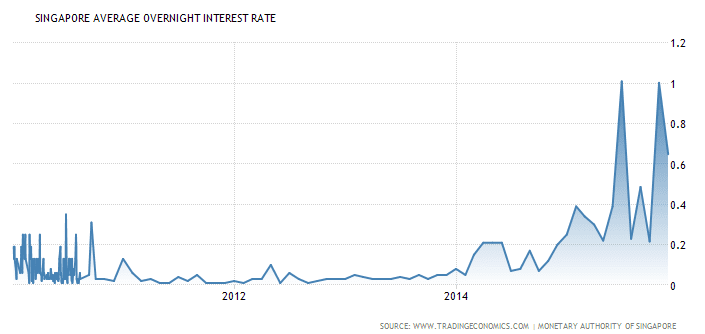
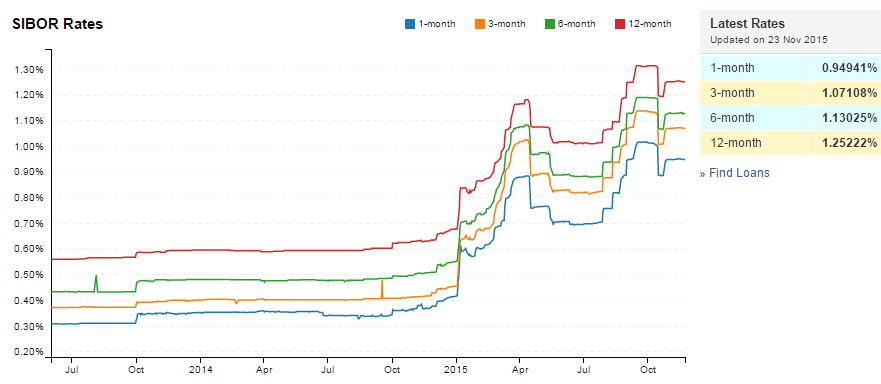
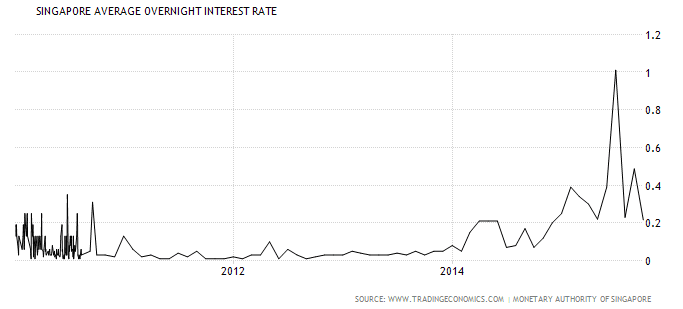
  • Singapore Interest Rate increases from 0.21% to 0.64%
  • 1 month increases from 0.88800% to 0.94941%
  • 3 month increases from 1.01050% to 1.07108%
  • 6 month increases from 1.06846% to 1.13025%
  • 12 month increases from 1.19551% to 1.25222%

Currently most  REITs in Singapore are trading below 200D SMA which is technically bearish (see Singapore REIT Charts here). Although the distribution yield are very attractive but do take note that this is a lagging number. As REIT is very much depends on the economic cycle, it is important to keep a close eye on economic data (i.e. GDP, consumer spending, PMI) as economic condition will affect the future NPI. NPI will affect Distribution and share price. However, some REITs are more defensive in nature and less sensitive to economy slow down.

Some of the REITs in Singapore are currently trading at an attractive valuation and yield.  Any knee jerk impact when the US Fed Reserve increases the interest present a good opportunity to accumulate in small quantity to build up our investment portfolio which can generate consistent and predictable passive income for our retirement.

If you want to learn how to select a SAFE REITs with predictable and consistent distribution payout, enter at the right price and right time,come and join the seminar on How to Invest in Singapore REIT to generate Passive Income.

Continue ReadingSingapore REIT Fundamental Analysis Comparison Table – 6 December 2015

Singapore REIT Fundamental Analysis Comparison Table – 1 November 2015

  • Post author:

FTSE ST Real Estate Investment Trusts (FTSE ST REIT Index) increases from 692.19 to 722.93 (+4.4%) compare to last post on Singapore REIT Fundamental Comparison Table on Oct 3, 2015. The index rebounded from recent low of 650 to 740. The long term trend remains down as the index is trading below 200D SMA.   Current rebound is not supported by the volume. It remains to be seen whether this rebound is only a Dead Cat Bounce.

FTSE ST REIT Index Nov1-2015FTSE ST REIT Index Nov1-2015 (shareinvestor)

  • Price/NAV increases from 0.91 to 0.95.  (Singapore Overall REIT sector is slightly under value now)
  • Distribution Yield decreases from 7.51% to 7.24% (take note that this is lagging number). More than half of Singapore REITs (20 out of 37) have Distribution Yield > 7%. Current yield is attractive but dangerous to make investing decision purely base on the yield. Past performance does NOT equal to future performance.
  • Gearing Ratio increases from 34.09% to 34.54%. 19 out of 37 have Gearing Ratio more than 35%.
  • Most overvalue is Parkway Life (Price/NAV = 1.38),  followed by Ascendas iTrust (Price/NAV = 1.35).
  • Most undervalue (base on NAV) is OUE Commercial REIT (Price/NAV = 0.62), followed by Fortune REIT (Price/NAV = 0.64).
  • Higher Distribution Yield is iREIT Global (9.48%), followed by Croesus RTrust (9.39%) . 
  • Highest Gearing Ratio is Croesus Retail Trust (47.3%) followed by Keppel REIT (42.6%)

Singapore-REIT-Fundamental-Analysis-and-Comparison-Table-1-Nov-2015

Disclaimer: The above table is best used for “screening and shortlisting only”. It is NOT for investing (Buy / Sell) decision. To learn how to use the table and make investing decision, Sign up next REIT Investing Seminar here to learn how to choose a fundamentally strong REIT for long term investing for passive income generation.

Singapore Interest Rate Nov1-2015 SIBOR Nov1-2015

  • Singapore Interest Rate decreases from 0.49% to 0.21%
  • 1 month decreases from 1.01741% to 0.88800%
  • 3 month decreases from 1.13933% to 1.01050%
  • 6 month decreases from 1.19083% to 1.06846%
  • 12 month decreases from 1.31225% to 1.19551%

Currently most  REITs in Singapore are still trading below 200D SMA which is technically bearish. Although the distribution yield are very attractive but do take note that this is a lagging number. As REIT is very much depends on the economic cycle, it is important to keep a close eye on economic data (i.e. GDP, consumer spending, PMI) as economic condition will affect the future NPI. NPI will affect Distribution and share price. However, some REITs are more defensive in nature and less sensitive to economy slow down. If you want to find out those REITs which have very high distribution yield but not affected much by Interest Rate Hike & Economy slow down, check out the How to Invest in Singapore REIT to generate Passive Income here.


Continue ReadingSingapore REIT Fundamental Analysis Comparison Table – 1 November 2015