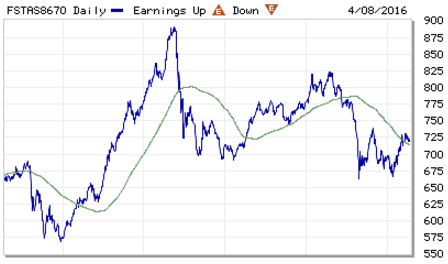
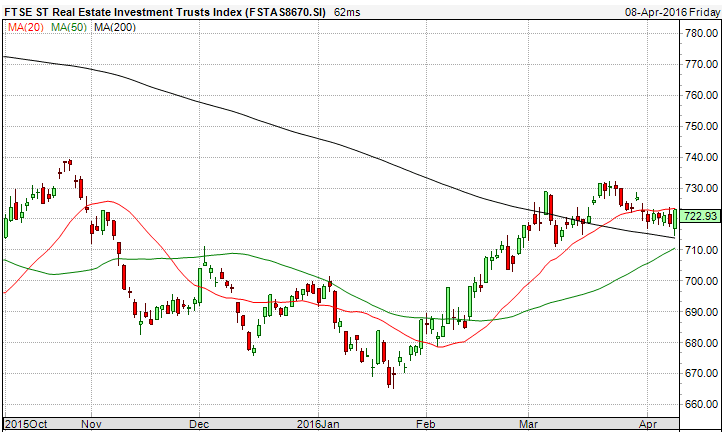
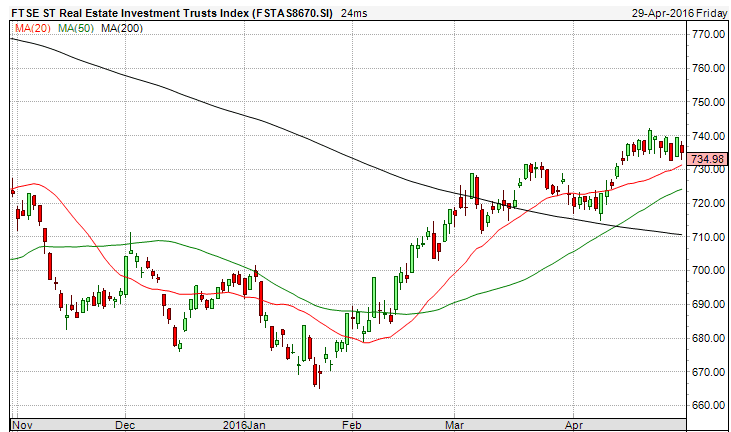
FTSE ST Real Estate Investment Trusts (FTSE ST REIT Index) increases from 722.93 to 734.98 (+1.67%) compare to last post on Singapore REIT Fundamental Comparison Table on April 10, 2016. The index stays above all 3 moving averages 20D/50D/200D SMA and also forming a “Higher High Higher Low” pattern indicates a clear up trend. However, it is important to take note that the 200D SMA slope is still sloping down. SGX S-REIT (REIT.SI) Index at 1127.56.

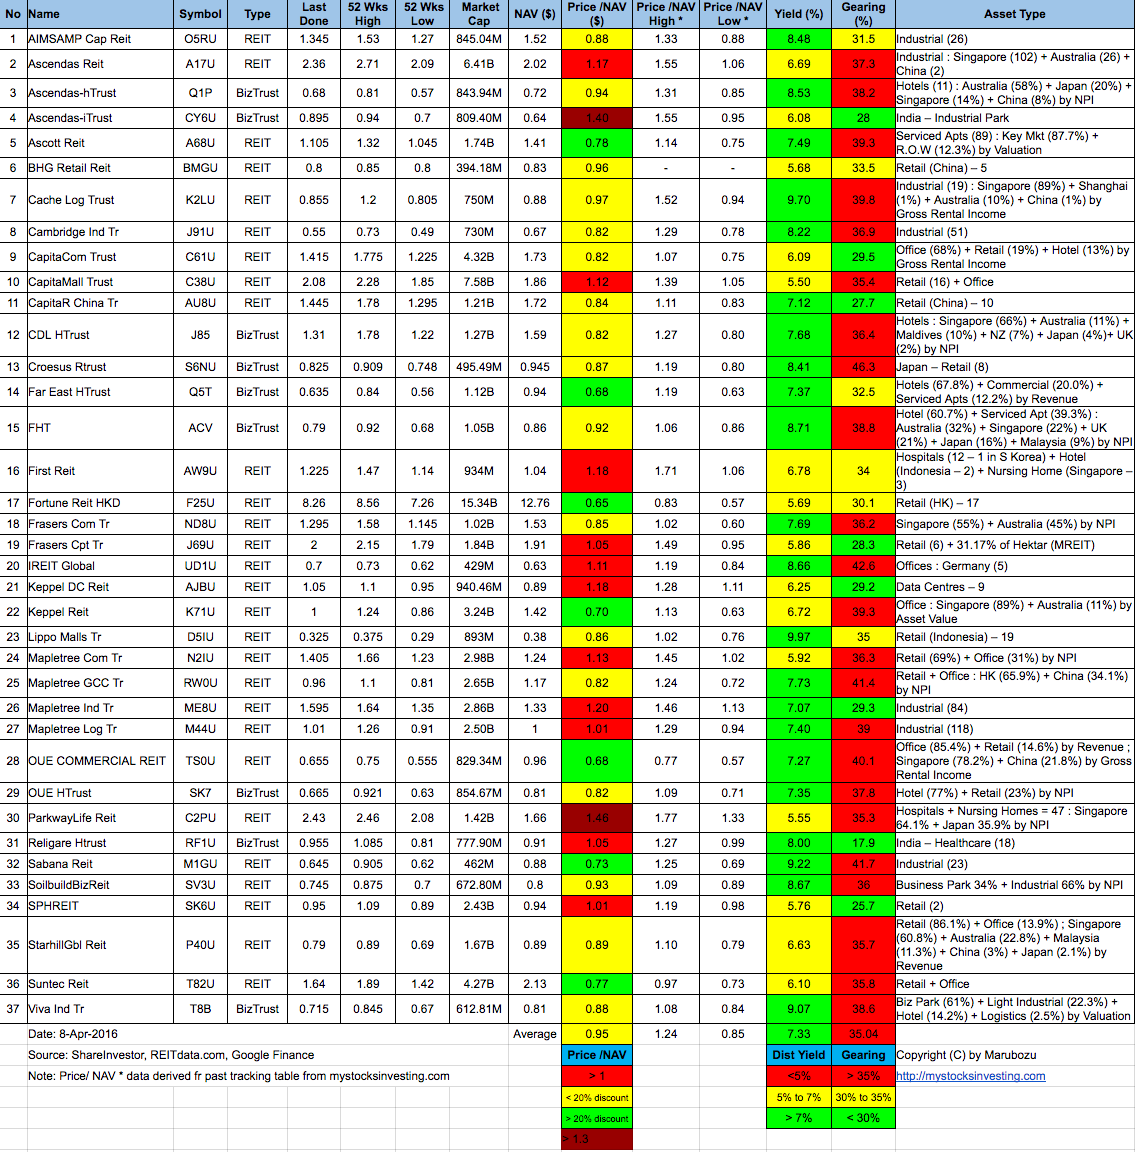
- Price/NAV increases from 0.95 to 0.965 (Singapore Overall REIT sector is under value now)
- Distribution Yield decreases from 7.33% to 7.1% (take note that this is lagging number). More than half of Singapore REITs (19 out of 37) have Distribution Yield > 7%. Current yield is attractive (for certain REITs only) but dangerous to make investing decision purely base on the yield. Past performance does NOT equal to future performance.
- Gearing Ratio decreases from 35.04% to 34.92%. 23 out of 37 have Gearing Ratio more than 35%.
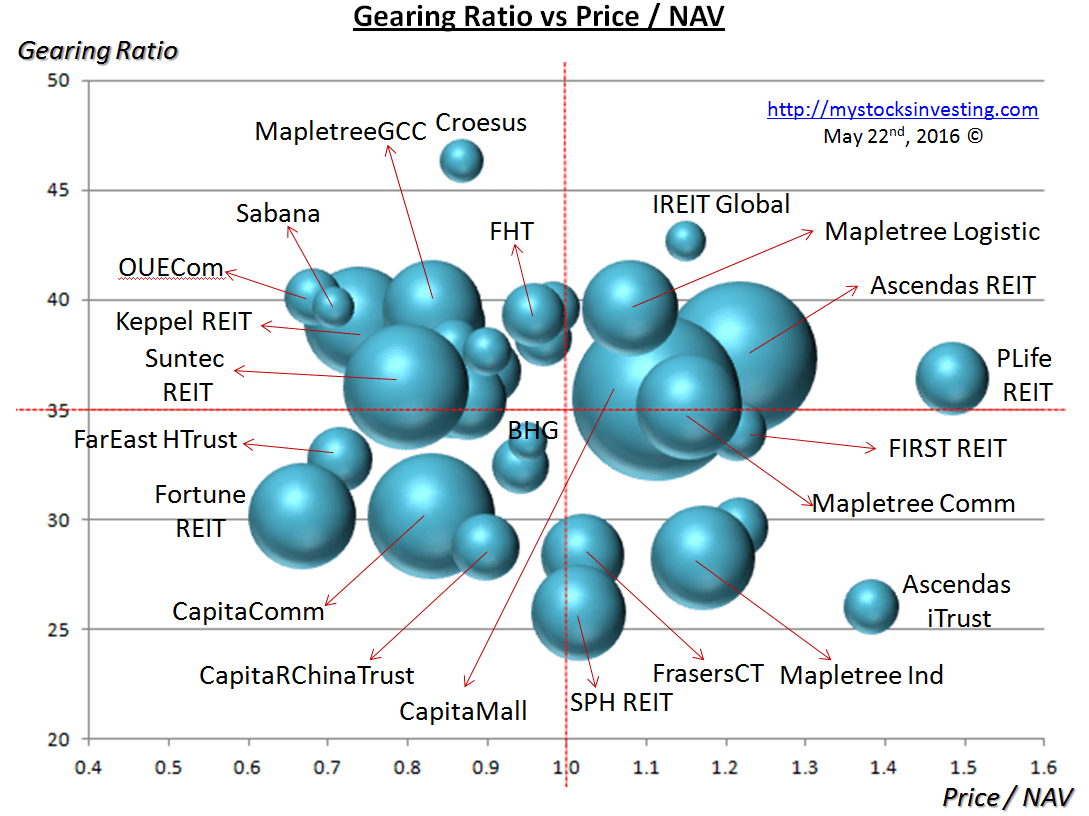
- Most overvalue is Parkway Life (Price/NAV = 1.485), followed by Ascendas iTrust (Price/NAV = 1.384).
- Most undervalue (base on NAV) is Fortune REIT (Price/NAV = 0.668), followed by OUE Commercial REIT (Price/NAV = 0.682) and Far East HTrust (Price/NAV = 0.715).
- Higher Distribution Yield is Lippo Malls Trust (9.97%) followed by Cache Logistic Trust (9.48%)
- Highest Gearing Ratio is Croesus Retail Trust (46.3%) followed by iREIT Global (42.6%)
- Note: Saizen REIT is removed from the table.
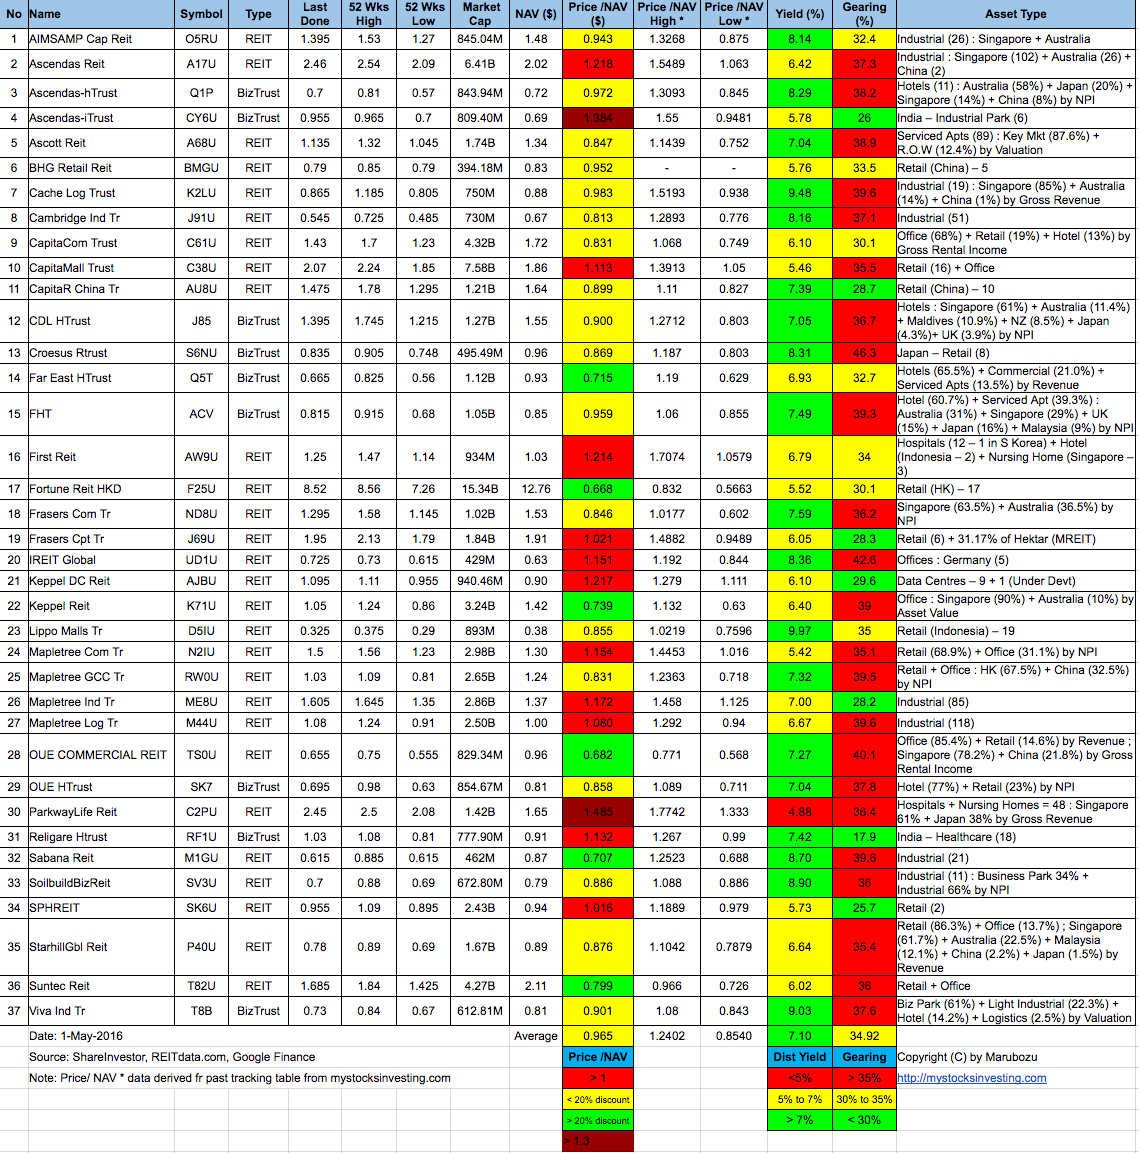
Disclaimer: The above table is best used for “screening and shortlisting only”. It is NOT for investing (Buy / Sell) decision. To learn how to use the table and make investing decision, Sign up next REIT Investing Seminar here to learn how to choose a fundamentally strong REIT for long term investing for passive income generation.
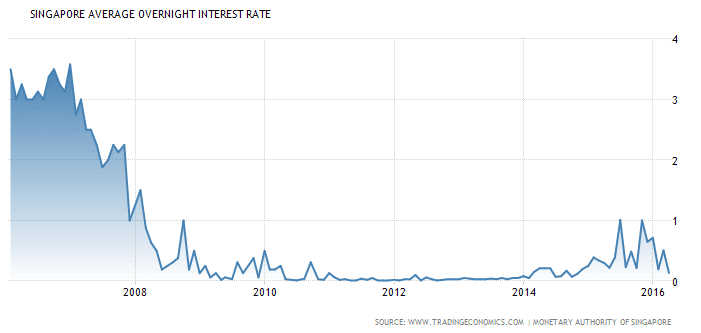
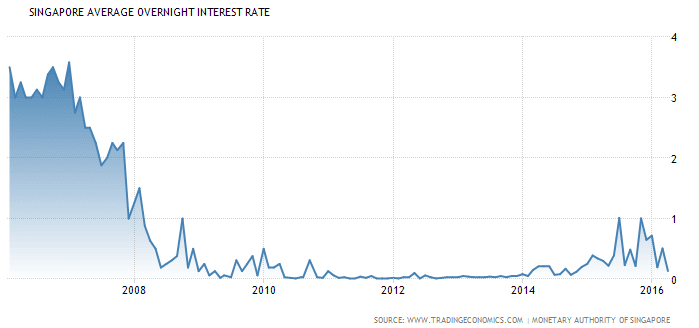
- Singapore Interest Rate maintains at 0.13%
The Monetary Authority of Singapore (MAS) set the rate of appreciation of the Singapore dollar policy band at zero percent beginning 14th April 2016, shifting from a modest and gradual appreciation policy. The surprise decision came after preliminary data showed the island city-state economy grew by 1.8 percent yoy in the first quarter of 2016, unchanged from the previous two quarters. On a quarter-on-quarter basis, growth was flat. “This is not a policy to depreciate the domestic currency,” MAS said, adding that it only removed the modest and gradual appreciation path of the Singapore dollar nominal effective exchange rate (S$NEER) policy band that was in place. “The width of the policy band and the level at which it is centered will be unchanged,” it added. Interest Rate in Singapore averaged 1.67 percent from 1988 until 2015, reaching an all time high of 20 percent in January of 1990 and a record low of -0.75 percent in October of 1993. Interest Rate in Singapore is reported by the Monetary Authority of Singapore.
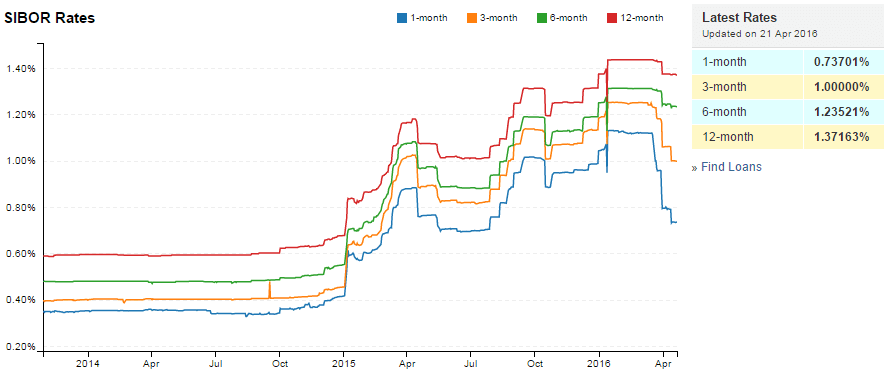
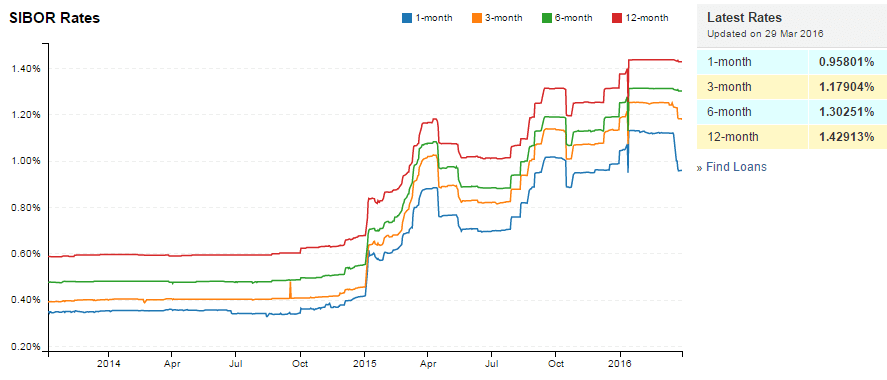
- 1 month decreases from 0.95801% to 0.73701%
- 3 month decreases from 1.17904% to 1.00000%
- 6 month decreases from 1.30251% to 1.23521%
- 12 month decreases from 1.42913% to 1.37163%

-
The Singapore PMI rose to 49.4 in March of 2016 from 48.5 in the previous month, the highest since December of 2015. Factory activity remained in contraction for the ninth consecutive month, though new orders, exports, factory output and employment improved. Manufacturing PMI in Singapore averaged 50.13 from 2012 until 2015, reaching an all time high of 51.90 in October of 2014 and a record low of 48.30 in October of 2012. Manufacturing PMI in Singapore is reported by the Singapore Institute of Purchasing & Materials Management, SIPMM.
Technically Singapore REITs sector is starting an uptrend. The share prices of Singapore REITs with bigger market capitalisation (e.g. Ascendas REIT, CapitaMall Trust, Capita Comm Trust, Keppel REIT, Suntec REIT) have moved up significantly for the past 3 months. Thus, the valuation and distribution yields for these REITs are not so attractive compares to the second liners. As the Singapore REIT Index is moving into the bullish territory, it is expected the second liners of Singapore REITs with attractive valuation and yield to catch up eventually. However, it is important to note that NOT all the sectors are performing due to the weak economy outlook.
Find out Which Singapore REIT to Buy, Which Sectors to consider, and When is the Right Time to Buy in the next Singapore REITs Investing class.