Singapore REIT Fundamental Analysis Comparison Table – 3 October 2015
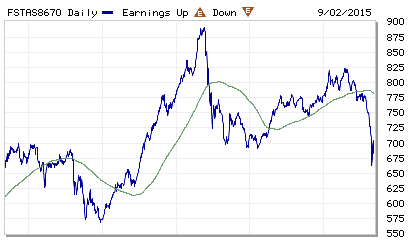
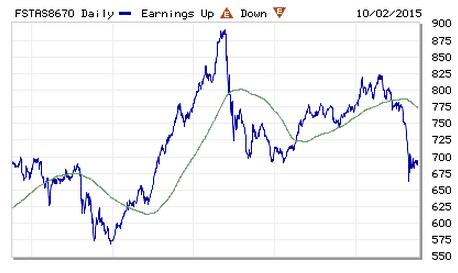
FTSE ST Real Estate Investment Trusts (FTSE ST REIT Index) increases from 683.6 to 692.19 (+1.26%) compare to last post on Singapore REIT Fundamental Comparison Table on Sept 2, 2015. The index is currently consolidating in a Bearish Pennant pattern before the next move and waiting for US Fed to increase the interest rate. If the support of this Bearish Pennant is broken, expect a further selling off. This is not the right time to accumulate any REITs at the moment although the Distribution Yield and valuation looks very attractive. Need to keep a close eye on how this REIT Index re-acts after the US Fed increases interest rate. So, sit back, relax and wait for the chart to tell us when is the right time to do the shopping.
.
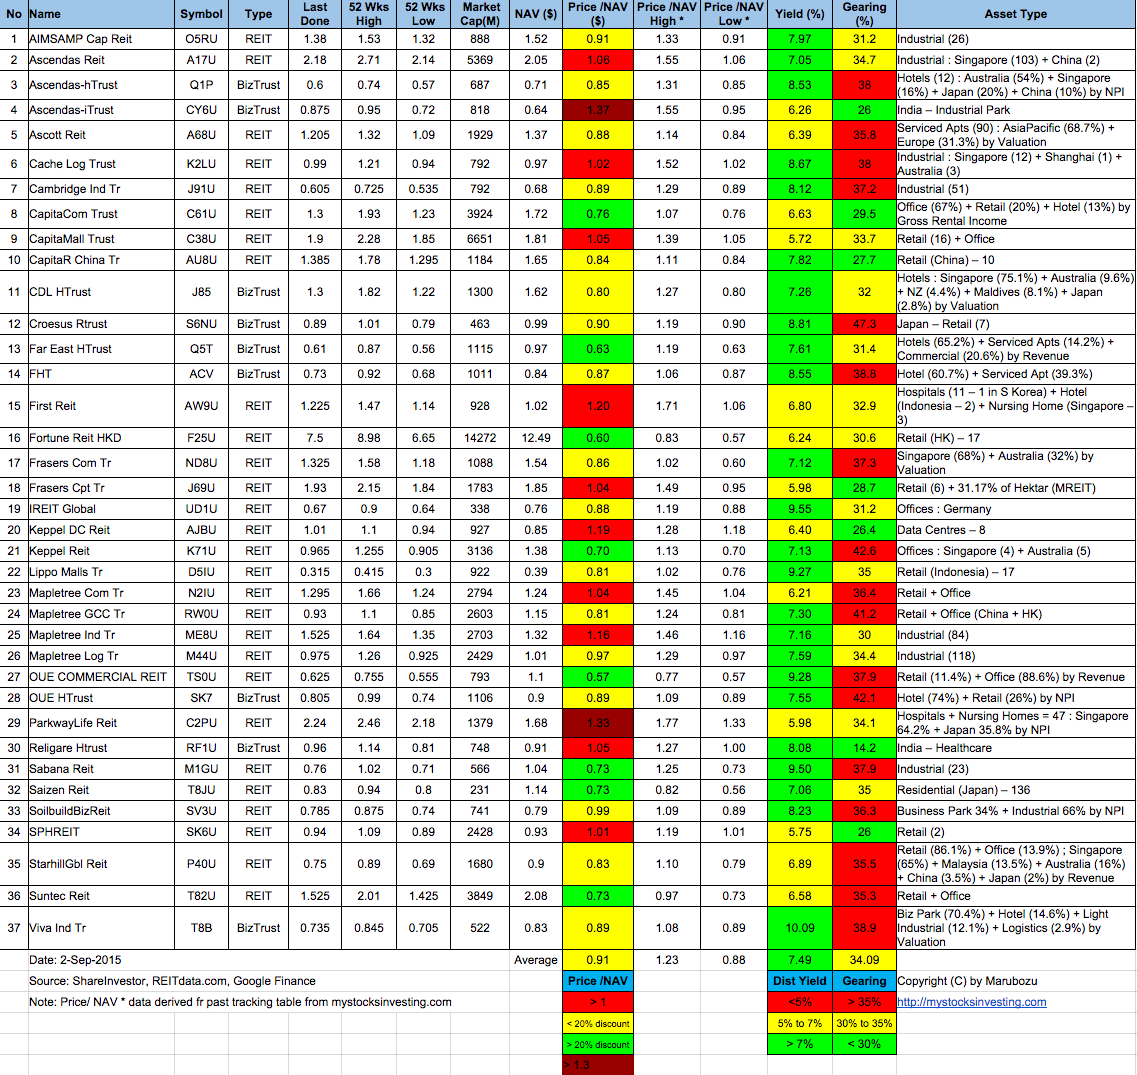
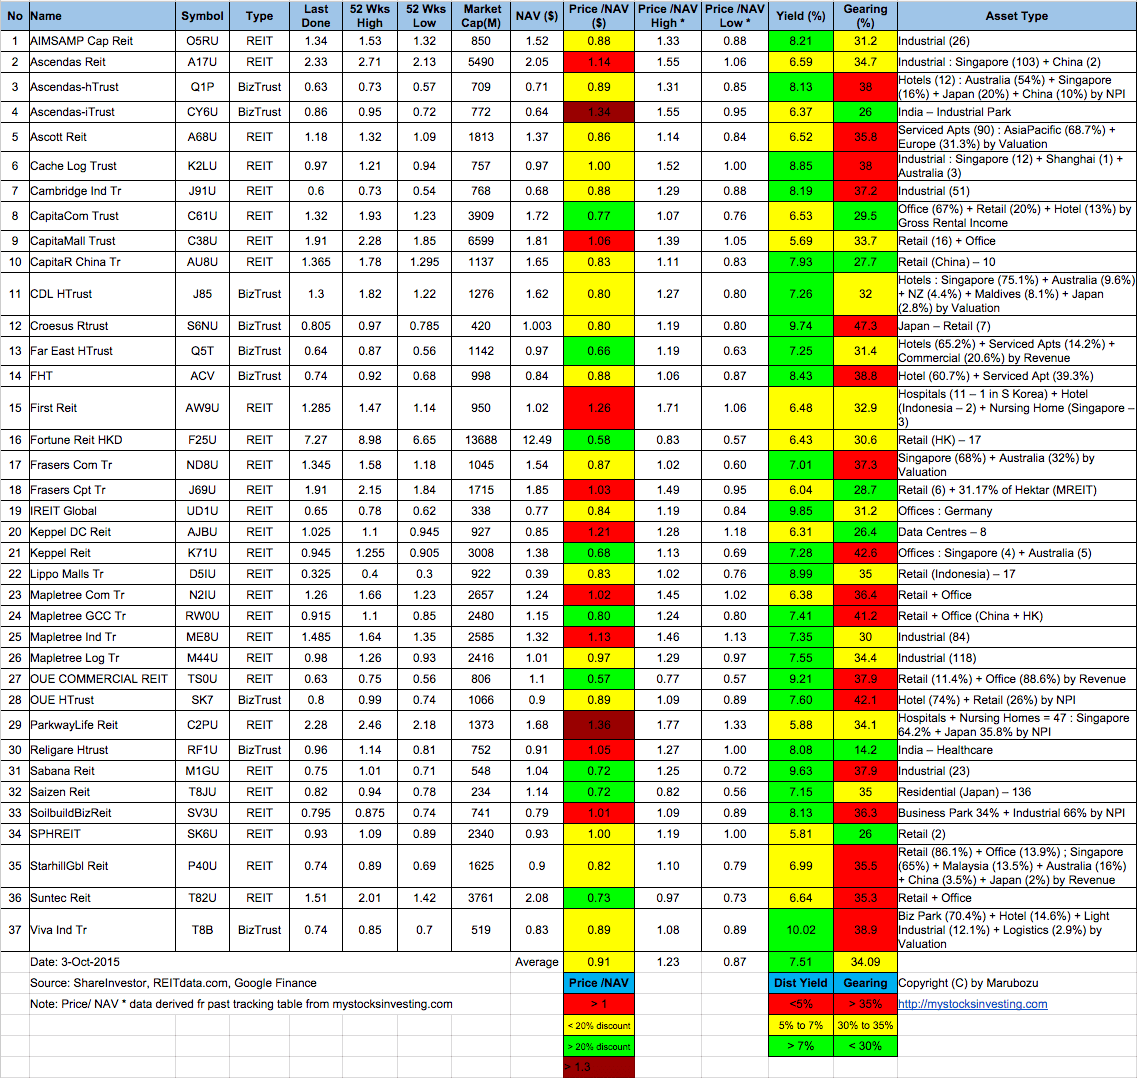
- Price/NAV remains at 0.91. (Singapore REIT is under value now)
- Distribution Yield increases from 7.49% to 7.51% (take note that this is lagging number). Current yield is attractive but dangerous to make investing decision purely base on the yield. Past performance does NOT equal to future performance.
- Gearing Ratio maintains at 34.09%
- Most overvalue is Ascendas iTrust (Price/NAV = 1.34) followed by Parkway Life (Price/NAV = 1.36).
- Most undervalue is OUE Commercial REIT (Price/NAV = 0.57), followed by Fortune REIT (Price/NAV = 0.58).
- Higher Distribution Yield is VIVA Industrial Trust (10.02%) followed by iREIT Global (9.85%). Note: Yes!! It is very attractive but we have to understand the Risks and whether the distribution is sustainable or not. High Distribution Yield does not mean it is safe REIT for investment. Don’t invest purely base on the Yield % because it is wrong thing to do without knowing the reasons.
- Highest Gearing Ratio is Croesus Retail Trust (47.3%) followed by Keppel REIT (42.6%)
Disclaimer: The above table is best used for “screening and shortlisting only”. It is NOT for investing (Buy / Sell) decision. To learn how to use the table and make investing decision, Sign up next REIT Investing Seminar here to learn how to choose a fundamentally strong REIT for long term investing.
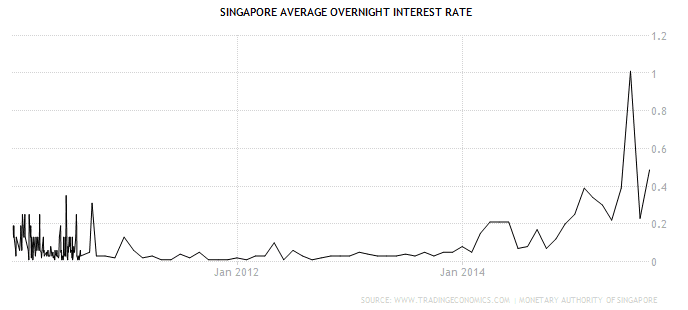
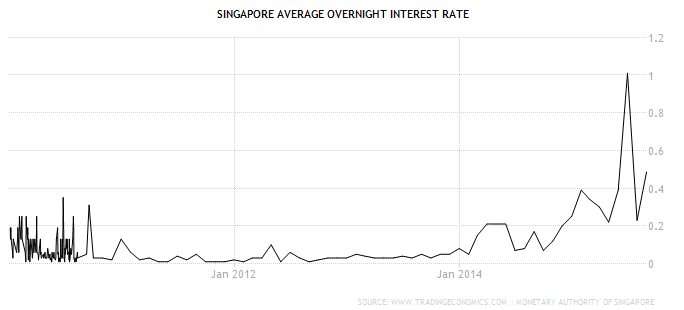
- Singapore Interest Rate increases from 0.45% to 0.49%
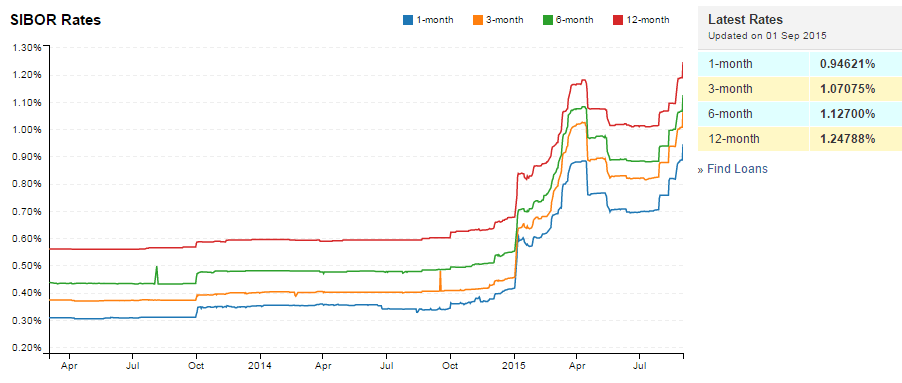
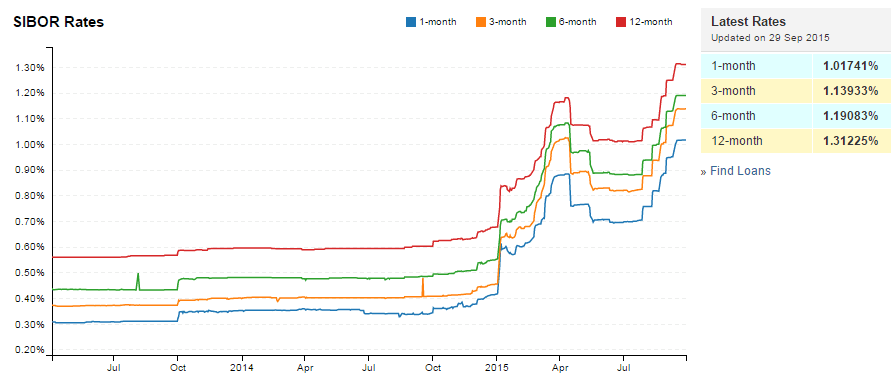
- 1 month increases from 0.94621% to 1.01741%
- 3 month increases from 1.07075% to 1.13933%
- 6 month increases from 1.12700% to 1.19083%
- 12 month increases from 1.24788% to 1.31225%
Currently all the REITs in Singapore started the down trend and in the short term consolidation. If there is no further sell down after the US Fed announces interest rate hike which is expected by end of 2015, the current correction of Singapore REITs provides a good opportunity to pick up some fundamental strong REITs for long term passive income investing. So, prepare your Great Singapore REIT Shopping list now!
Check out the How to Invest in Singapore REIT to generate Passive Income here.