New SGX S-REIT Index vs FTSE ST Real Estate Investment Trust (FSTAS8670)

  • Post author:

SGX has just launched a new REIT index to track Singapore Real Estate Investment Trust (REIT) performance.

Brief introduction of SGX S-REIT Index:

The SGX S-REIT Index was established last year. It is a free-float, market capitalisation-weighted index that measures the performance of stocks operating within the REIT Sector. The 10 largest constituents of the SGX S-REIT Index account for 64.7% of the Index weights.

The Index is also diversified across types of property assets. The Global Industry Classification Standard (GICS®) is applied by SGX StockFacts to help define the different sectorial focus within the REIT sector. Retail REITs, which are made up of shopping malls, account for the largest index weights. CapitaLand Mall Trust, a retail REIT, was the first REIT to list in 2002, almost thirty years after Singapore’s first shopping centre became air-conditioned. The Retail REIT Sector spans businesses engaged in the acquisition, development, ownership, leasing, management and operation of shopping malls, outlet malls, neighbourhood and community shopping centres.

Constituents of the SGX S-REIT Index are diversified by property type in addition to location. More than half the trusts have property assets located outside Singapore, mostly around Asia. This includes countries such as China, Hong Kong, Vietnam, Japan, Indonesia, South Korea, Philippines and Malaysia.

SGX S-REIT index Sectors Feb26-2016


SGX S-REIT Index Composition To be eligible for index inclusion, the industry group of the trust must be classified as a Real Estate Investment Trust by the Thomson Reuters Business Classification (TBRC). This means the SGX S-REIT Index is not solely made up of the REITs that are governed by the Collective Investment Scheme, but can include Business Trusts and Stapled Trusts, both of which are governed by the Business Trust Act.

SGX S-REIT Index consists of 32 SGX S-REIT Index constituents, 25 are REITs, five are Stapled Trusts and two are Business Trusts (Ascendas India Trust and Croesus Retail Trust). The 25 REITs make up 89.4% of the SGX S-REIT Index, while Stapled Trusts make up 7.7%, and Business Trusts comprise 2.9%. SGX S-REIT Index is rebalanced periodically.

REITs and Stapled Trust that are not currently included in the index:

  • BHG Retail REIT
  • Fortune REIT
  • Keppel DC REIT
  • Saizen REIT.
  • Ascendas Hospitality Trust 

SGX S-REIT index Components Feb26-2016 SGX S-REIT index Components1 Feb26-2016 SGX S-REIT index Components2 Feb26-2016

Chart is not meaningful at the moment as there are no much data available.

At the point of writing, SGX S-REIT Index is at 1089.137.

FTSE ST Real Estate Investment Trust (FSTAS8670) 

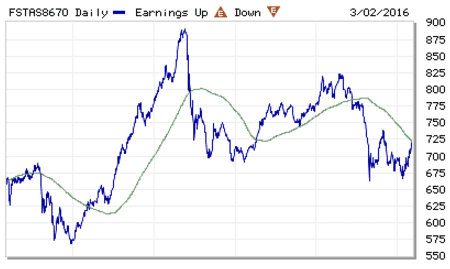
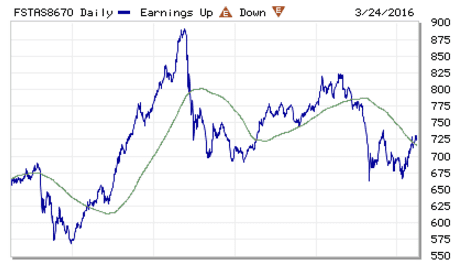
This FTSE ST Real Estate Investment Trust is a well established index which have been tracking Singapore REIT sectors for quite some times. There are total 33 index components in this FSTAS8670 index. However, it is not clear whether this index is derived from weighted market capitalisation.  At the point of writing, FSTE ST Real Estate Investment Trust is at 713.71.

FSTAS8670 Chart Jan29-2016 FSTAS8670 Components Jan29-2016

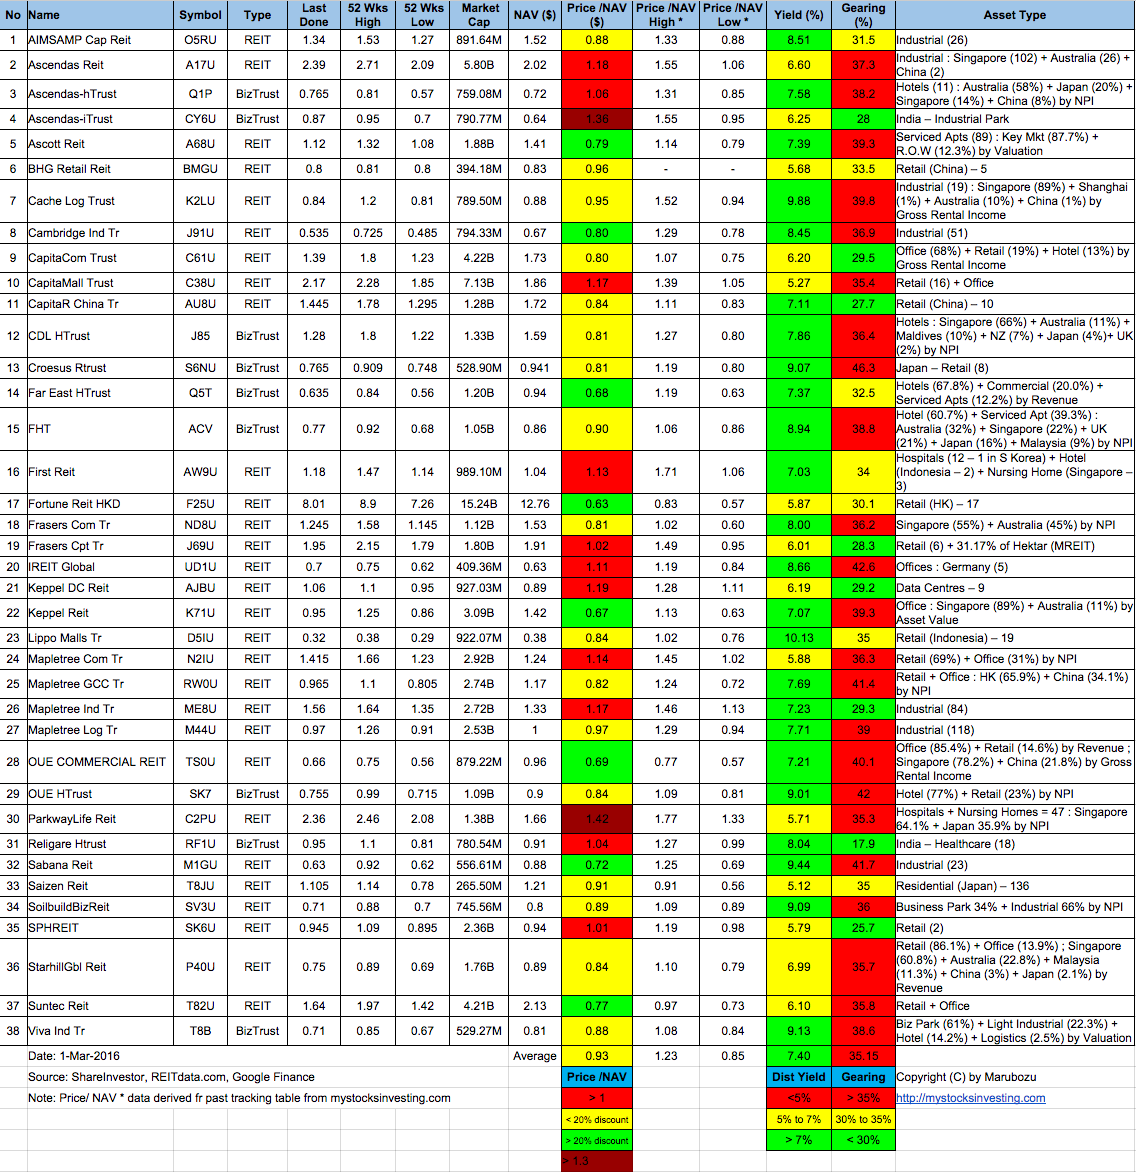
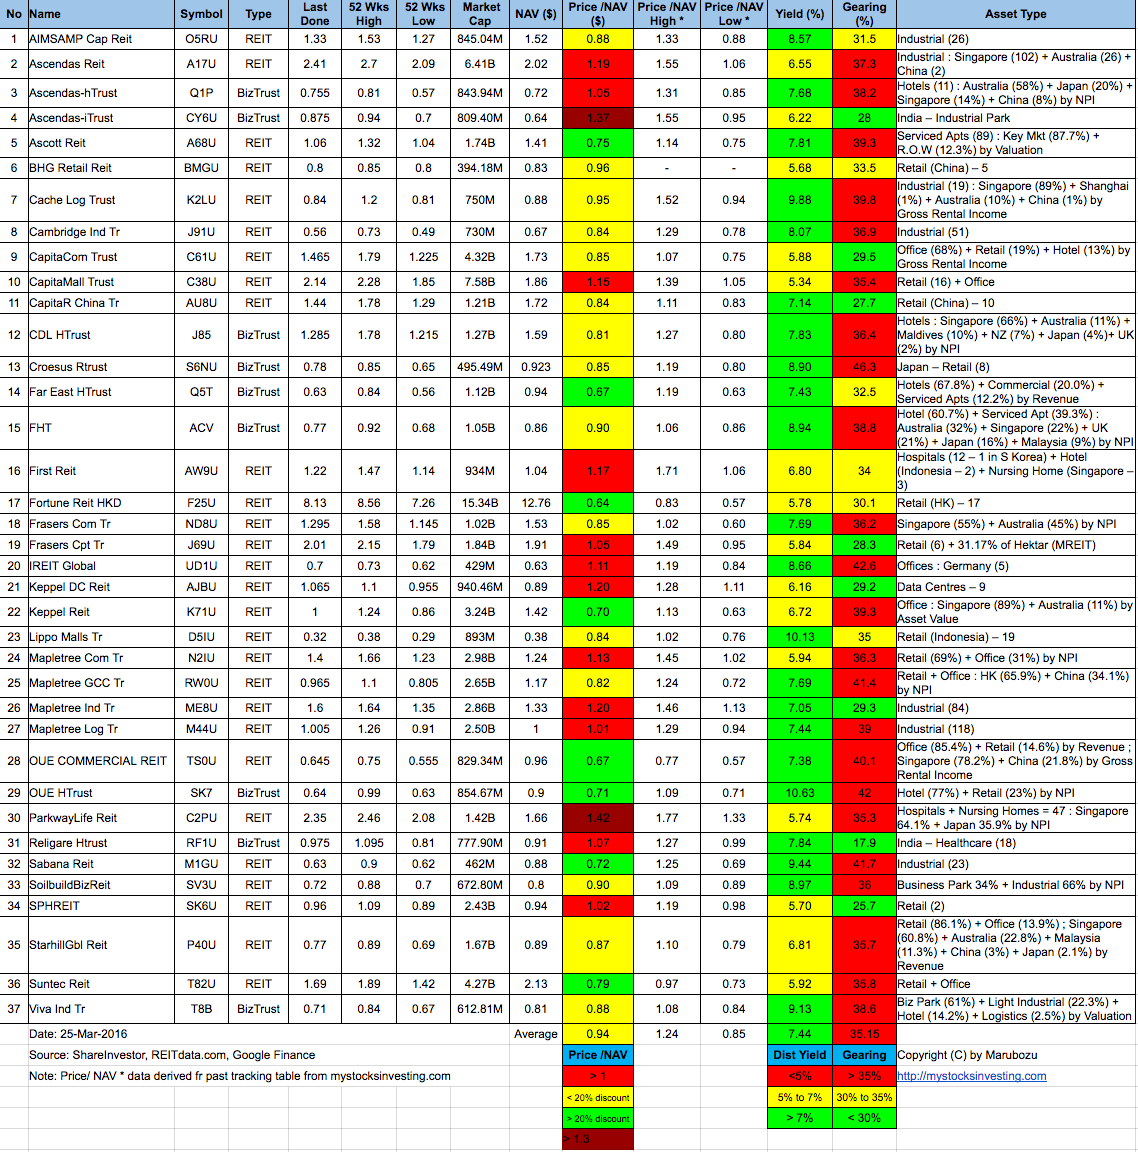
See Singapore REIT Fundamental Analysis Comparison Table

Find out How to Generate Passive Income through REIT Investing here.

Continue ReadingNew SGX S-REIT Index vs FTSE ST Real Estate Investment Trust (FSTAS8670)

Singapore REIT Fundamental Analysis Comparison Table – 1 February 2016

  • Post author:

FTSE ST Real Estate Investment Trusts (FTSE ST REIT Index) decreases from 695.93 to 688.7  (-1.04%) compare to last post on Singapore REIT Fundamental Comparison Table on Jan 3, 2016. The index is consolidating in a Symmetrical Triangle pattern. The long term trend remains down as the index is trading below 200D SMA which is also sloping down. 

FTSE ST REIT Index Feb1-2016

Latest ranking of the FTSE ST Real Estate Investment Index’s components base on Market Capitalisation as followed:

FTSE ST REIT Components Jan 29-2016

Top 5 Market Cap Singapore REIT:

  1. CapitaMall Trust
  2. Ascendas REIT
  3. Suntec REIT
  4. CapitaCom Trust
  5. Keppel REIT
  • Price/NAV reduces from 0.93 to 0.91  (Singapore Overall REIT sector is under value now)
  • Distribution Yield increases from 7.36% to 7.60% (take note that this is lagging number).  More than half of Singapore REITs (25 out of 38) have Distribution Yield > 7%. Current yield is attractive but dangerous to make investing decision purely base on the yield. Past performance does NOT equal to future performance.
  • Gearing Ratio increases from 34.78% to 35.11%.  23 out of 37 have Gearing Ratio more than 35%.
  • Most overvalue is Parkway Life (Price/NAV = 1.36),  followed by Ascendas iTrust (Price/NAV = 1.25).
  • Most undervalue (base on NAV) is Fortune REIT (Price/NAV = 0.61), followed by Keppel REIT (Price/NAV = 0.63), Far East HTrust (Price/NAV = 0.66) and OUE Commercial REIT (Price/NAV = 0.66).
  • Higher Distribution Yield is Croesus RTrust (10.19%), followed by Lippo Malls Trust (9.94%)
  • Highest Gearing Ratio is Croesus Retail Trust (47.6%) followed by iREIT Global (43.4%)

Singapore-REIT-Fundamental-Analysis-and-Comparison-Table-1-Feb-2016


Disclaimer: The above table is best used for “screening and shortlisting only”. It is NOT for investing (Buy / Sell) decision. To learn how to use the table and make investing decision, Sign up next REIT Investing Seminar here to learn how to choose a fundamentally strong REIT for long term investing for passive income generation.

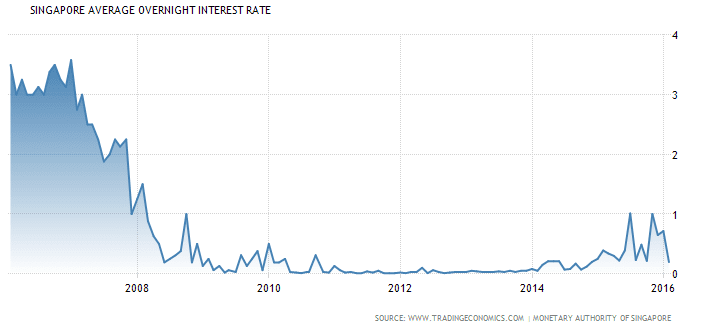
SIBOR Feb1-2016 Singapore Interest Rate Feb1-2016

  • Singapore Interest Rate increases from 0.23% to 0.72%
  • 1 month increases from 0.98806% to 1.13025%
  • 3 month increases from 1.13700% to 1.25300%
  • 6 month increases from 1.19175% to 1.31475%
  • 12 month increases from 1.31525% to 1.43800%

Technically the Singapore REITs sectors is trading in a consolidation or down trend direction. Some REITs with good fundmental have reached a very attractive valuation and yield level. As the general investment sentiment is weak, it is a good time to start your shopping list to build a retirement portfolio for Passive Cash Flow.

warren-buffett-quotes

Singapore REIT is still one of the best instrument for investment which can generate consistent and predictable passive income for our retirement. If you want to learn how to select a SAFE REITs with predictable and consistent distribution payout, enter at the right price and right time, and understand what are the down side risks, come and join the seminar on How to Invest in Singapore REIT to generate Passive Income.

Continue ReadingSingapore REIT Fundamental Analysis Comparison Table – 1 February 2016

Singapore REIT Stock Picks Bubble Charts Jan 2016

  • Post author:

Bubble chart derived from Jan 3, 2016 Singapore REITs Fundamental Comparison Table. No big changes compare to previous Singapore REIT Bubble Chart, Singapore REIT sector yield is quite attractive at the moment.

These Bubble Charts are used to show the “relative” position compare to other Singapore REITs.

Two visual bubble charts to pick and avoid:

  1. Undervalue Singapore REITs with High Distribution Yield** (Value Pick)
  2. Overvalue Singapore REITs with High Gearing Ratio (Risk Avoidance)

** Distribution Yield are lagging.

The Singapore REIT Bubble charts are best used to visually Short List Singapore REIT only.

Singapore REIT Bubble Chart (Value) Jan9-2016Singapore REIT Bubble Chart (Risk) Jan9-2016


Find out How to Select Singapore REIT using Bubble Charts for Safe Dividend Investing here.

Continue ReadingSingapore REIT Stock Picks Bubble Charts Jan 2016