UOL Group: Long Term Trend is still Up. Good time to buy?

  • Post author:

UOL Group has dropped more than 12% since the historical high and currently sitting on the 200D SMA support. Is it the Right time to buy?

Technically base on the chart pattern, UOL Group is still showing a long term up trend but currently short term downward pressure is pretty strong. It is important to watch whether UOL Group can find the good support and rebound from the long term up trend at about $6.80.

Original post by Marubozu My Stocks Investing Journey.

UOL June5-2015

UOL Group Fundamental

  • PE (TTM) = 8.79
  • PE (5 Years High) = 7.92
  • PE (5 Years Low) = 4.51
  • Price to Book (MRQ) = 0.72
  • Dividend Yield = 2.1%
  • Current Ratio = 1.46
  • Debt to Equity (MRQ) = 37.05

UOL Group Limited (UOL) is engaged in investing in properties, subsidiaries, associated companies, and listed and unlisted securities. The Company operates in four segments: property development and property investment, concentrated in Singapore, Malaysia and China; hotel operations, concentrated in Singapore, Australia, Vietnam, Malaysia, China and Myanmar and key asset and profit contributions are from the hotels in Singapore and Australia; investments, which relates to the investments in equity shares in Singapore, and management services to companies and hotels in Singapore and overseas. The Company’s diversified portfolio consists of residential apartments, offices, retail malls, hotels, spas and restaurants. Together with hotel subsidiary, Pan Pacific Hotels Group Limited (PPHG), UOL owns and/or manages over 30 hotels, resorts and serviced suites in Asia, Oceania and North America under two brands, Pan Pacific and PARKROYAL.

Continue ReadingUOL Group: Long Term Trend is still Up. Good time to buy?

Fortune REIT Fundamental and Technical Analysis

  • Post author:

Fortune REIT Fundamental Analysis

  • Last Done Price = HK$7.77
  • NAV = HK$11.87
  • Price /  NAV = 0.654 (35.6% Discount to NAV)
  • Price /  NAV (High) = 0.832
  • Price /  NAV (Low) = 0.566
  • Distribution Yield = 5.8%
  • Gearing Ratio = 33.2%
  • Occupancy Rate = 98.1%

Last Fundamental Analysis for Fortune REIT.

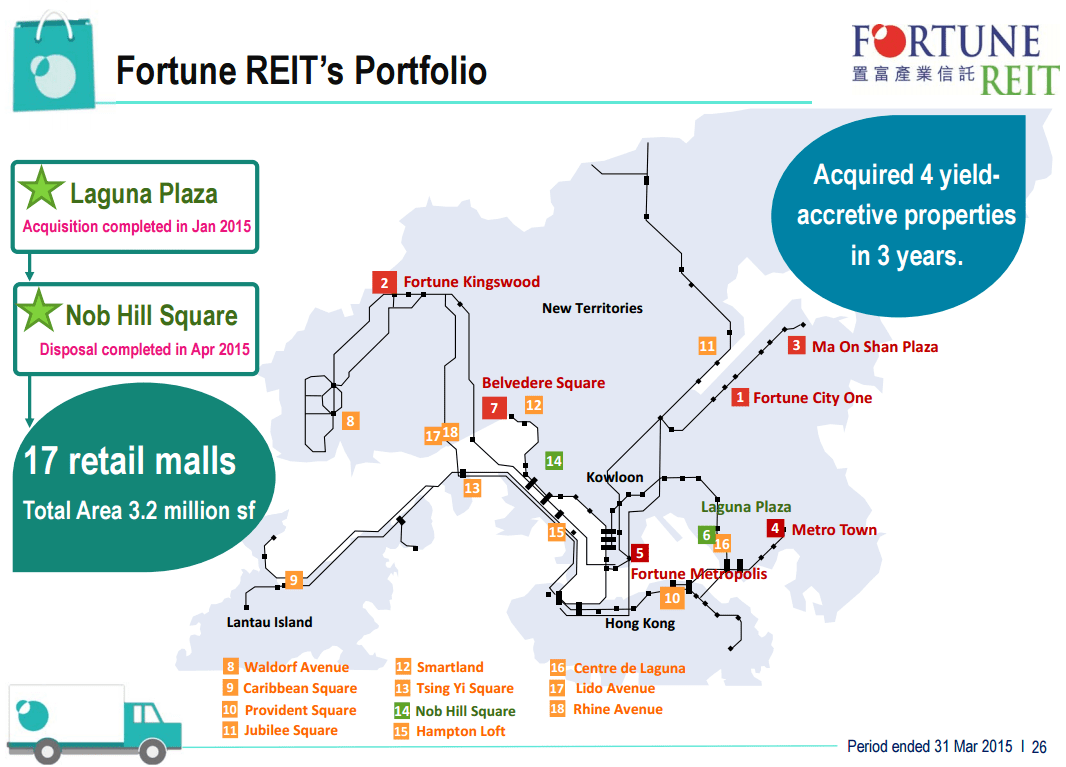
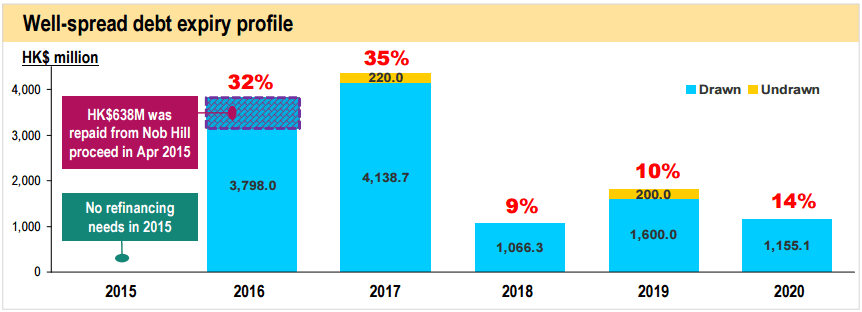
Fortune REIT Malls Location May29-2015Fortune REIT Occupancy Rate May29-2015Fortune REIT Debt Profile May 29-2015Fortune REIT WALE May29-2015

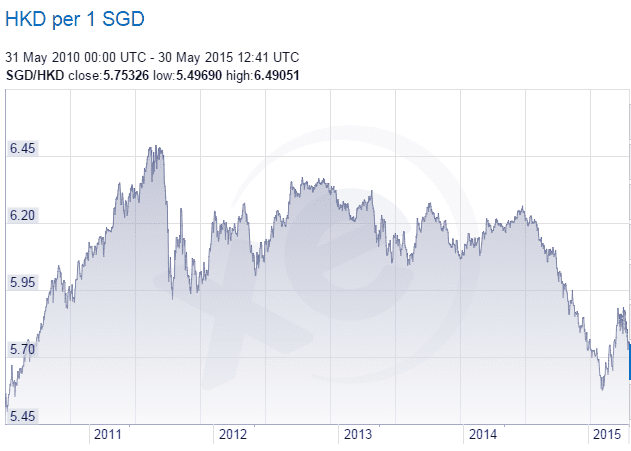
Currency Risk

SGD HKD Exchange Rate May30-2015


Fortune REIT Technical Analysis

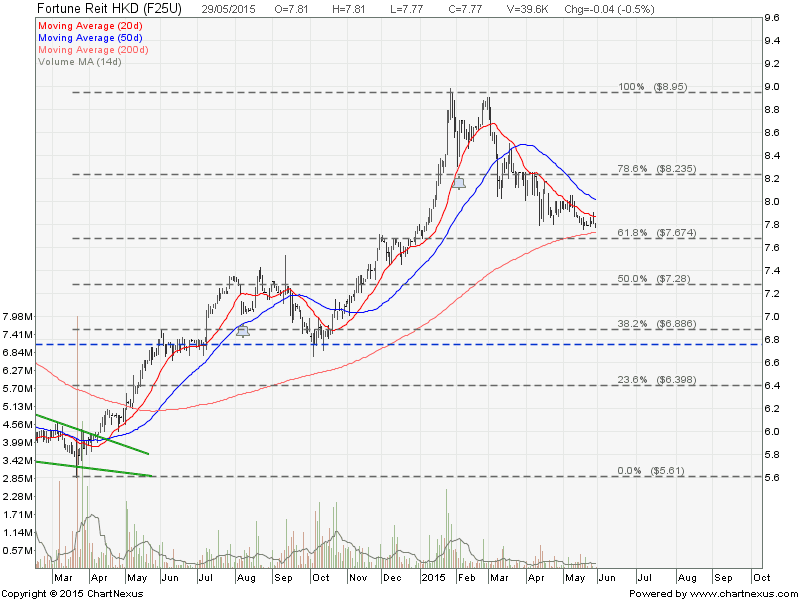
Fortune REIT has dropped about 13% from the high of about HK$9.00 and currently just sitting on the 200D SMA support. Coincidentally this 200D SMA is also the 61.8% Fibonacci Retracement Support. Watch closely whether this support level holds. If yes, it may be a good entry level to those who are interest to invest in Fortune REIT for the 6% Dividend Yield.

2015May29-Fortune Reit HK$-800x600


Check out the hands on REIT Investing class here to learn how to conduct Fundamental Analysis and Technical Analysis on Singapore REIT. Equip yourself the financial knowledge on how to select a Fundamental strong REIT to generate consistent passive income.

Timing is very important in stock investing because you will still lose money when you invest in the market down trend. You can use Technical Analysis to identify the trend to maximize your profit and protect yourself from losing money.

Continue ReadingFortune REIT Fundamental and Technical Analysis

Lippo Malls Indonesia Retail Trust (LMIR) Fundamental and Technical Analysis

  • Post author:

Lippo Malls Indonesia Retail Trust (LMIR) Fundamental Analysis

  • Last Done Price = $0.365
  • NAV = $0.42
  • Price /  NAV = 0.869 (13.1% Discount)
  • Price /  NAV (High) = 1.022
  • Price /  NAV (Low) = 0.76
  • Distribution Yield = 7.86% (base on DPU TTM)
  • Distribution Yield = 8.65% (assume 0.79 cents for next 4 Quarters)
  • Gearing Ratio = 31.6%
  • WALE = 4.90 Years
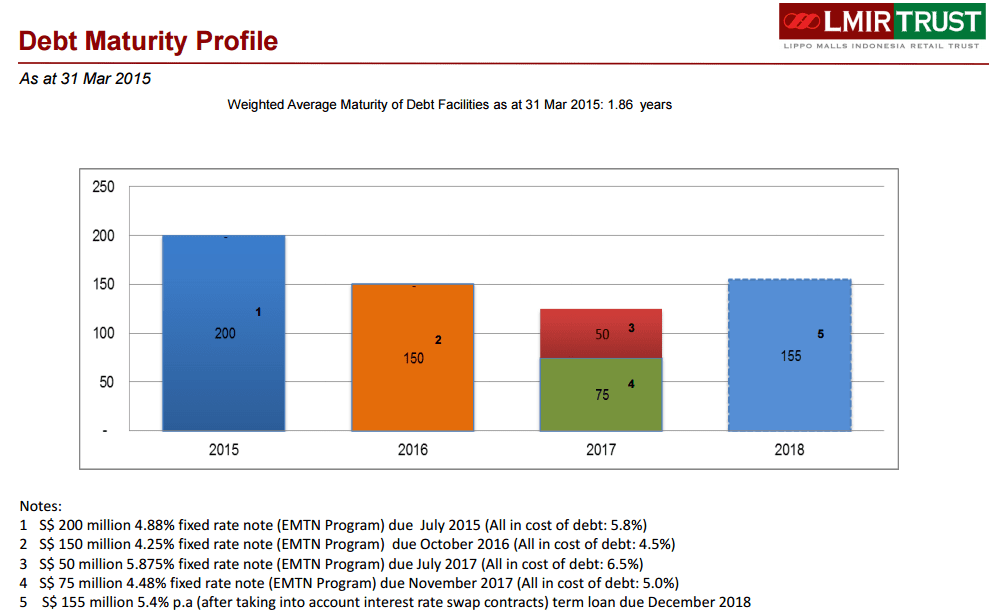
  • WADB = 1.86 Years

Last Fundamental Analysis for Lippo Malls Indonesia Retail Trust (LMIR)

Lippo Malls WADM May27-2015 Lippo Malls WALE May27-2015


Currency Risk

SGD IDR Exchange May27-2015


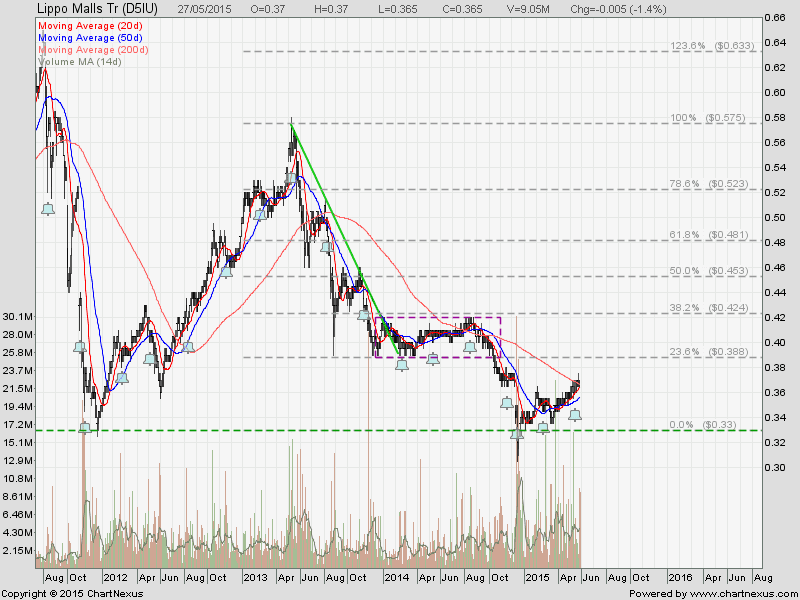
Lippo Malls Indonesia Retail Trust (LMIR) Technical Analysis

Lippo Malls May27-2015LMIR is on short term up trend (20 and 50D SMA trending up) and currently testing the 200D SMA resistance.


Summary

Fundamentally valuation and yield looks attractive and down side risk is limited to my own risk appetite. Technically LMIR has found the bottom at $0.30 and the trend is reversing. Current level looks like attractive entry level to me personally for long term investing.


Continue ReadingLippo Malls Indonesia Retail Trust (LMIR) Fundamental and Technical Analysis