Suntec REIT Fundamental Analysis
Base on Suntec REIT Q1FY15 Quarterly Earning Presentation
- Last Price = $1.75
- NAV = $2.085
- Price / NAV = 0.8393
- Price / NAV (High) = 0.97
- Price / NAV (Low) = 0.73
- Distribution Yield = 5.168%
- Gearing Ratio = 34.8%
- Occupancy Rate (Office) = 99.6%
- Occupancy Rate (Retail) = 93.5%
- Overall Occupancy = 93.6%
- WADM = 3.39 Years


See last Suntec REIT Fundamental Analysis here.
See Recent Sell off of Suntec REIT.
Suntec REIT Technical Analysis
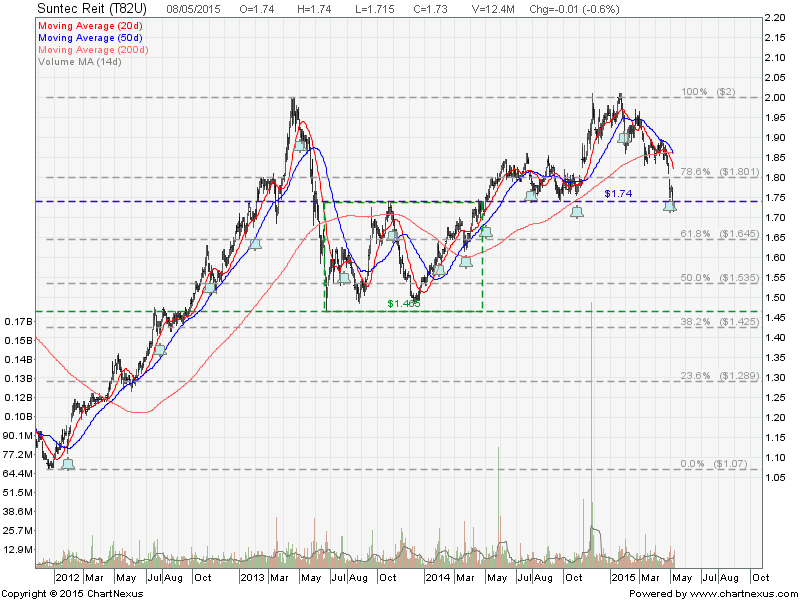
Suntec REIT has dropped about 13% from the peak in Jan 2015 and currently testing a critical resistance turned support level at about $1.74. Can Suntec REIT go lower?
Technically YES!
- Suntec REIT is trading below 20D, 50D and 200D SMA. 20D and 50D are trending down. These are bearish signal.
- Suntec REIT is trading within a down trend channel. “Lower Low, Lower High” down trend pattern is formed.
- If this resistance turned support at $1.74 is broken, there will be more down side.

In Summary
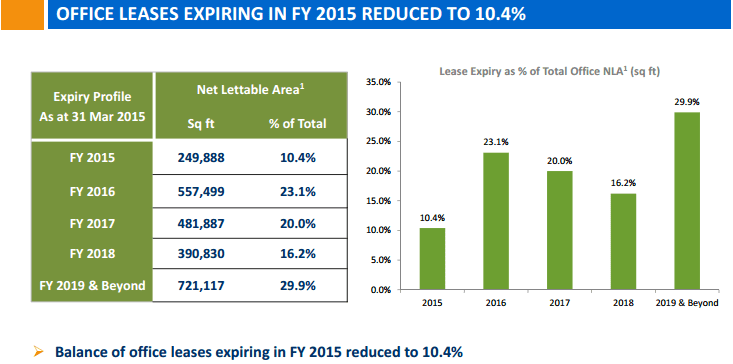
Fundamentally the distribution yield of 5.17% gives me no excitement. There are other Singapore REIT can offer higher distribution yield than Suntec REIT. WALE are not so attractive because there are 25% lease will be expiring in 2016. There is no guarantee that the rental can be renewed at higher rate due to the weakness in global economy. Technically Suntec REIT is on down trend although finding a temporary support at $1.74 (take note that a Double Bottoms is formed, a potential reversal pattern). As an investment rule: NEVER buy when the stock is on down trend.
I will be covering all the Fundamental and Technical Analysis steps in the coming REIT class. Check out the detail HERE. Invest safely and protect your capital! You must know what you are doing and do your own homework instead of listening to the tips.


