UOB Bank: The Scary $20
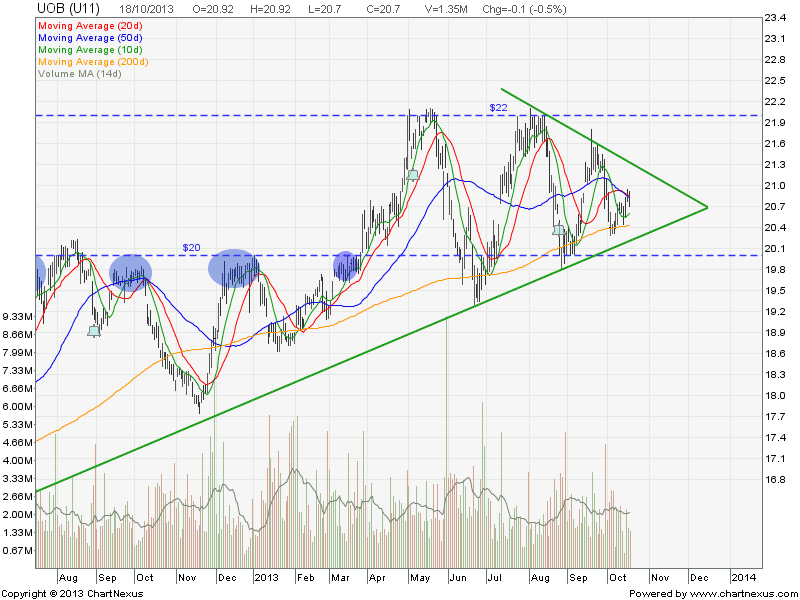
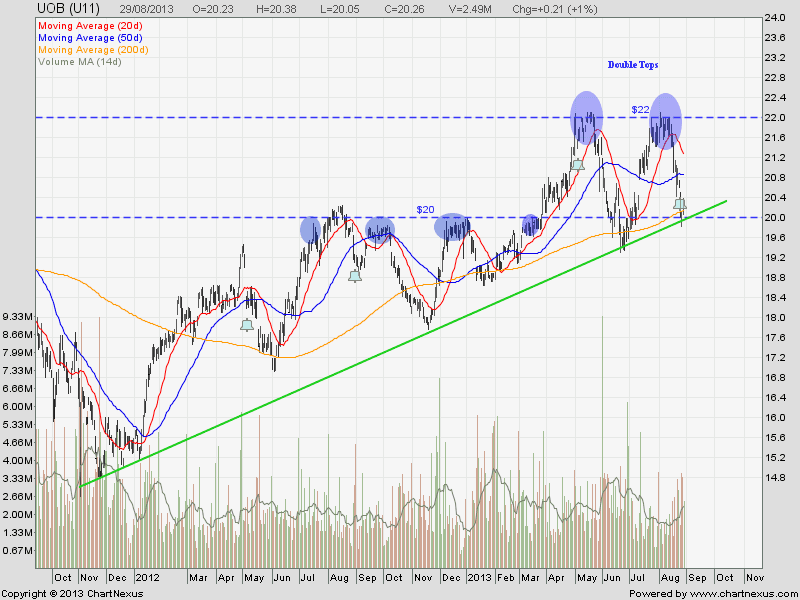
UOB has broken down from a Wedge and currently rebound to test the previous wedge support turned resistance at about $20.00. This $20 support turned resistance is a very significant level because it has been tested for no lesser than past 6 occasions for past 3 years. If UOB Bank is being rejected at $20 in the next few trading sessions, the stock will officially start a bearish down trend (lower high, lower low). Bad news for investors, good news for traders!

Original post by Marubozu from My Stocks Investing Journey.
UOB Bank Fundamental Data
| Current P/E Ratio (ttm) | 11.0598 |
|---|---|
| Estimated P/E(12/2013) | 11.1497 |
| Relative P/E vs. FSSTI | 0.8714 |
| Earnings Per Share (SGD) (ttm) | 1.7975 |
| Est. EPS (SGD) (12/2013) | 1.7830 |
| Est. PEG Ratio | 2.1307 |
| Market Cap (M SGD) | 31,341.37 |
| Shares Outstanding (M) | 1,576.53 |
| 30 Day Average Volume | 1,967,267 |
| Price/Book (mrq) | 1.3325 |
| Price/Sale (ttm) | 3.6349 |
| Dividend Indicated Gross Yield | 3.02% |
| Cash Dividend (SGD) | 0.2000 |
| Dividend Ex-Date | 08/26/2013 |
| 5 Year Dividend Growth | 1.49% |
| Next Earnings Announcement | 02/14/2014 |
VALUATION RATIOS
| Company | Industry | Sector | |
|---|---|---|---|
| P/E Ratio (TTM) | 10.94 | 12.56 | 13.15 |
| P/E High – Last 5 Yrs. | 16.60 | 16.34 | 24.91 |
| P/E Low – Last 5 Yrs. | 10.38 | 9.54 | 10.17 |