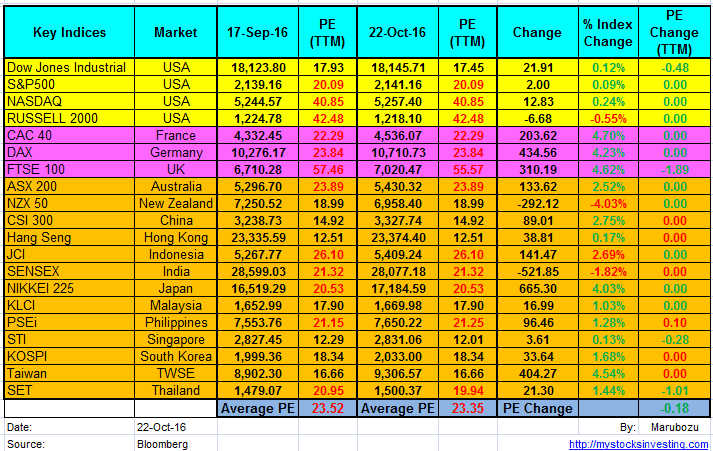
Global Stock Market Indices PE Ratio At a Glance (22 Oct 2016)
Market Indices PE Ratio for Major Stock Exchange globally
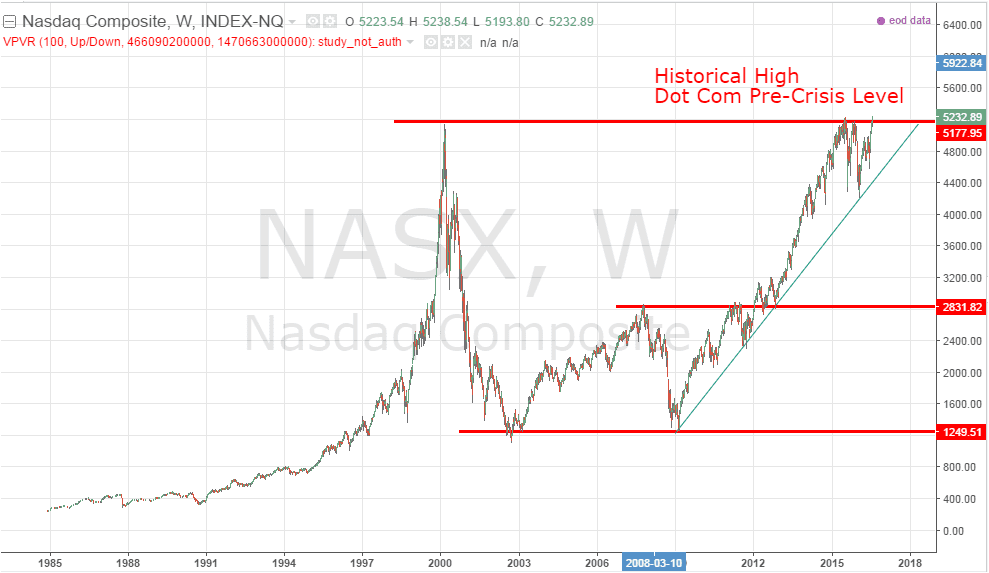
- US: Dow Jones Industrial, S&P500, NASDAQ, Russell 2000
- Europe: FTSE100, CAC40, DAX
- Asia: KLCI, STI, HangSeng, ASX200, CSI 300, JCI, SET, KOSPI, NIKKEI 225, SENSEX, TWSE, NZX50, PSEi
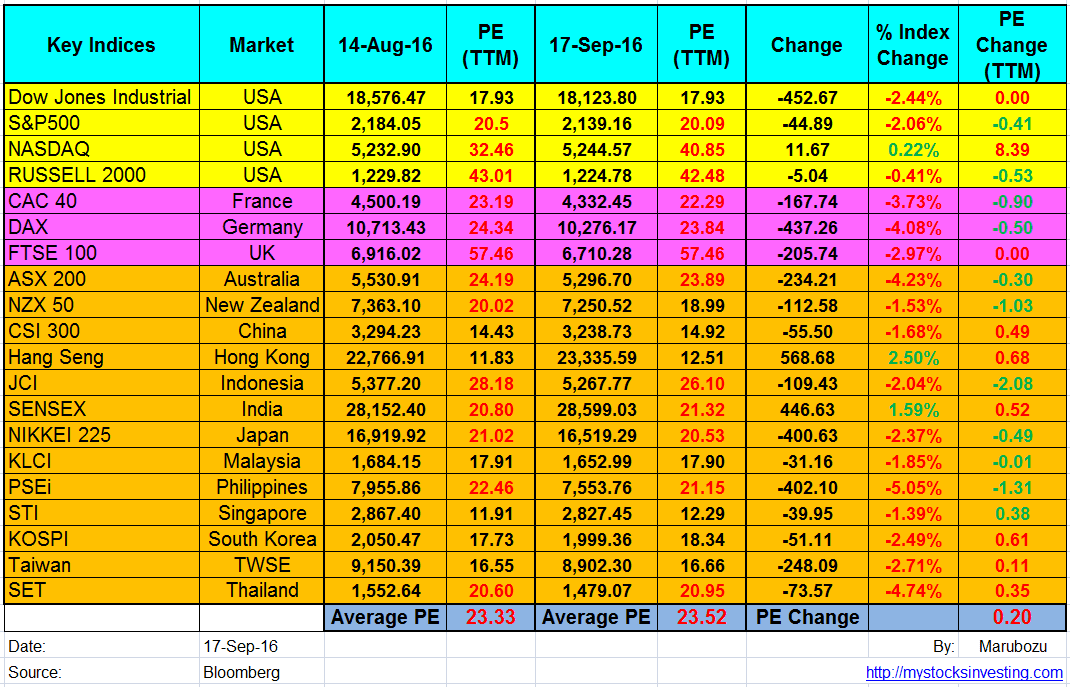
- Best Performer: France CAC40 up for 4.7% with PE Ratio of 22.29.
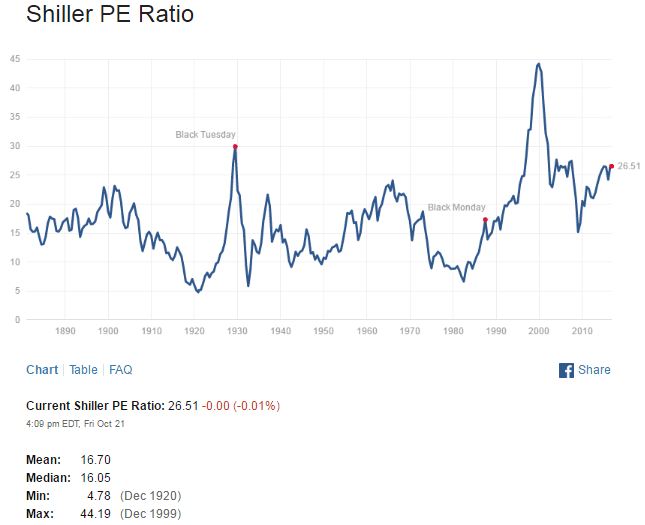
- Valuation of Global Stock Market is NOT cheap base on PE Ratio. Simple Average PE Ratio decreases from 23.52 to 23.35.
- Europe Stock Market was the best performers last month.
- Singapore STI has the lowest PE ratio of 12.01 compare to the rest of the world in the following table.
- PE = Price Per Earning
See Sept-2016 Global Stock Market PE Ratio here.
Original post from https://mystocksinvesting.com
See other event here. https://mystocksinvesting.com/events/