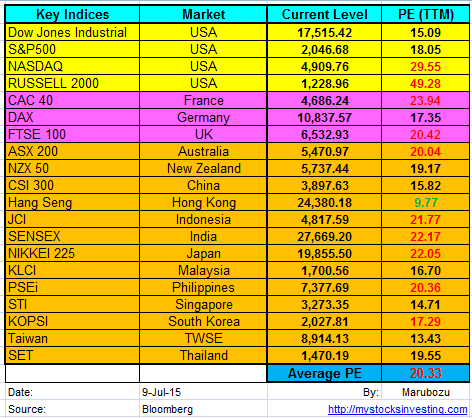
Global Stock Market Indices PE Ratio At a Glance (13 September 2015)
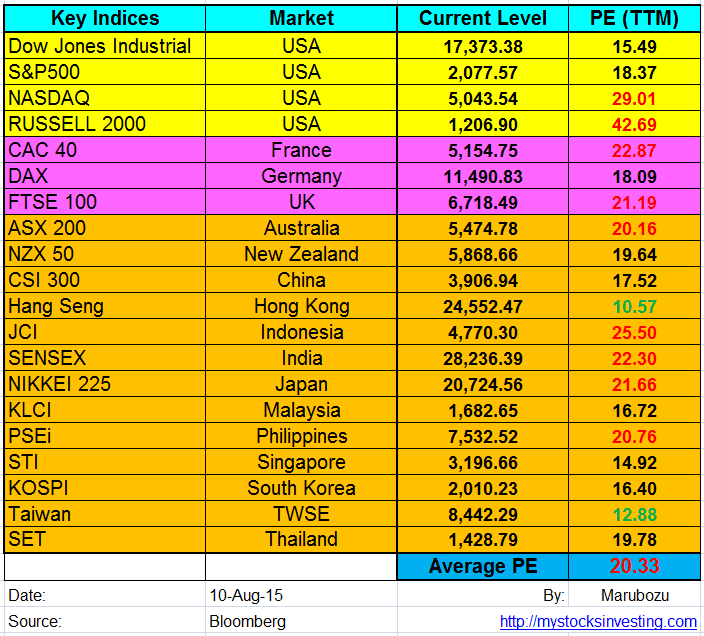
Market Indices PE Ratio for Major Stock Exchange globally
- US: Dow Jones Industrial, S&P500, NASDAQ, Russell 2000
- Europe: FTSE100, CAC40, DAX
- Asia: KLCI, STI, HangSeng, ASX200, CSI 300, JCI, SET, KOSPI, NIKKEI 225, SENSEX, TWSE, NZX50, PSEi
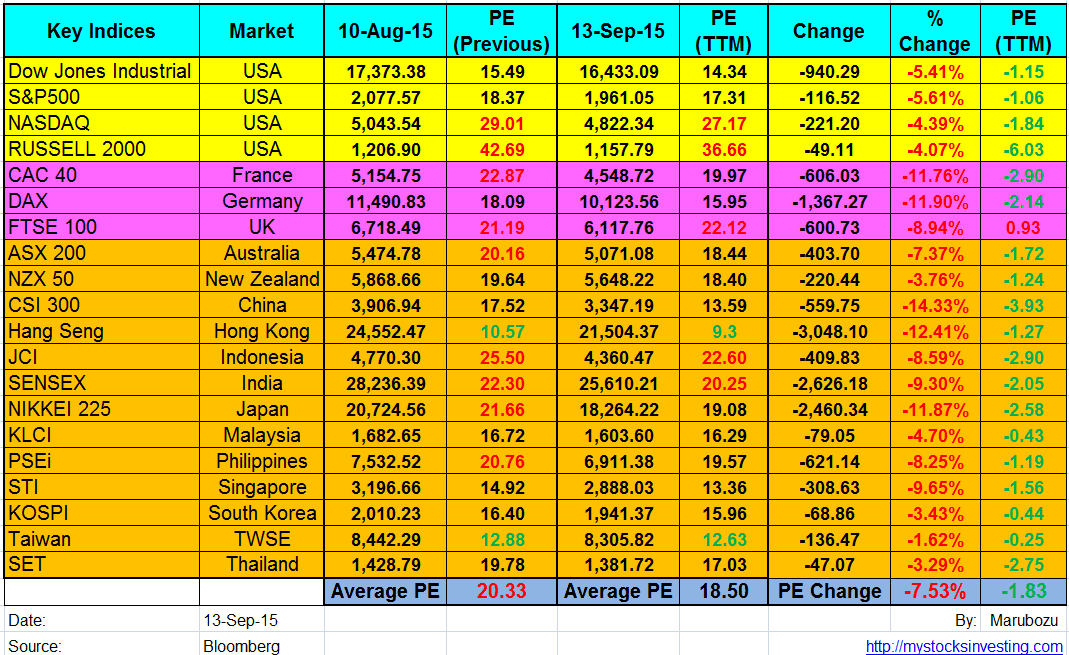
- PE = Price Per Earning
See Aug 2015 Global Stock Market PE Ratio here.
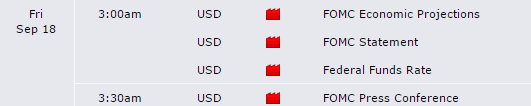
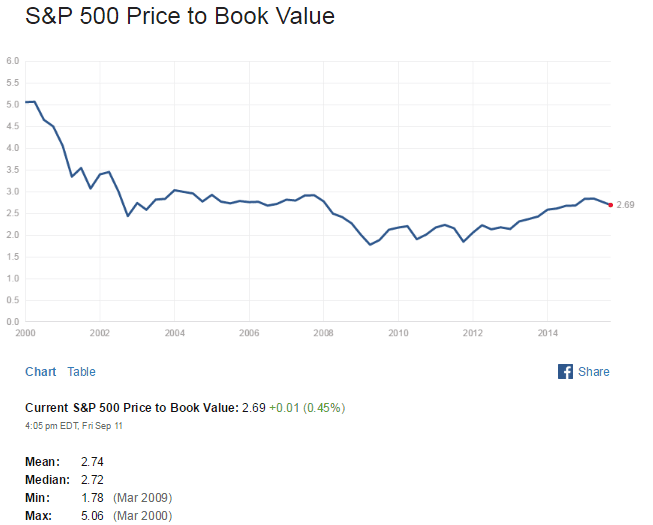
Average PE ratio reduced from 20.33 to 18.50 after Global Stock Market Sell off in August. August 24, 2015 was recorded as one of the worst Black Monday in stock market history. VIX still maintains at a high level at 24.20 showing that the fear is still pretty much in the market. Any shock may cause another round of selling off. Next week all eyes will be on FOMC minutes and see whether the US Federal Reserve is going to raise interest rate. Technically $INDU, $SPX, $COMPQ, $RUT are showing Bearish Pennant which going to breakout soon. Fasten your Seat Belt!


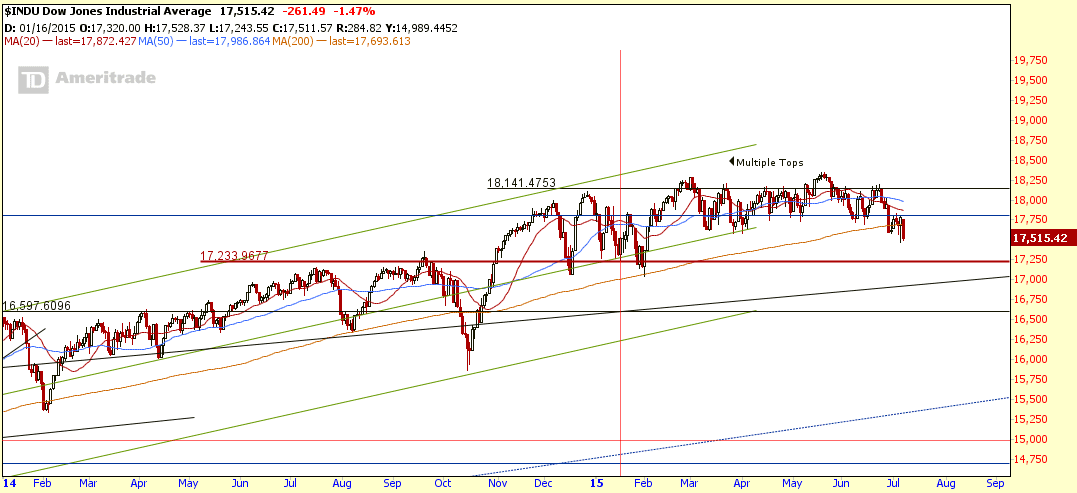
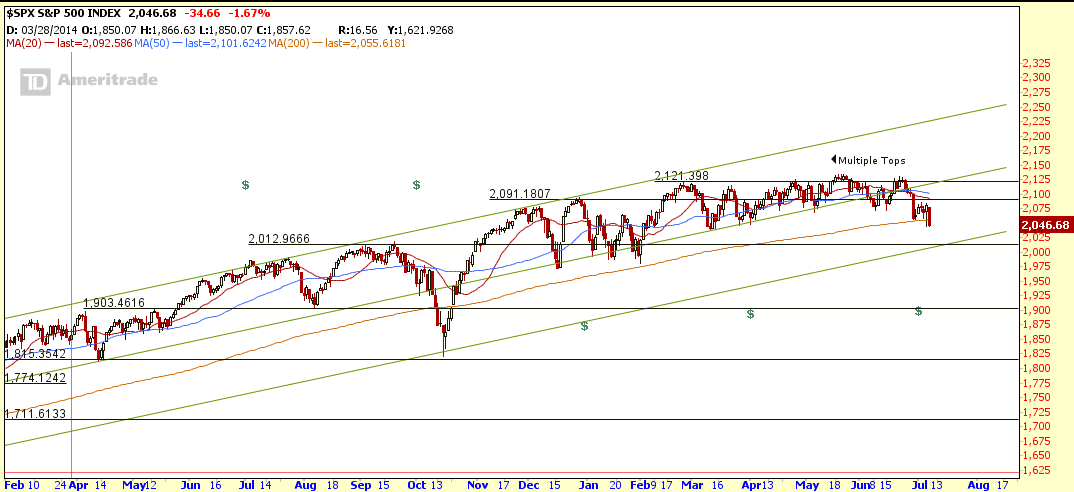
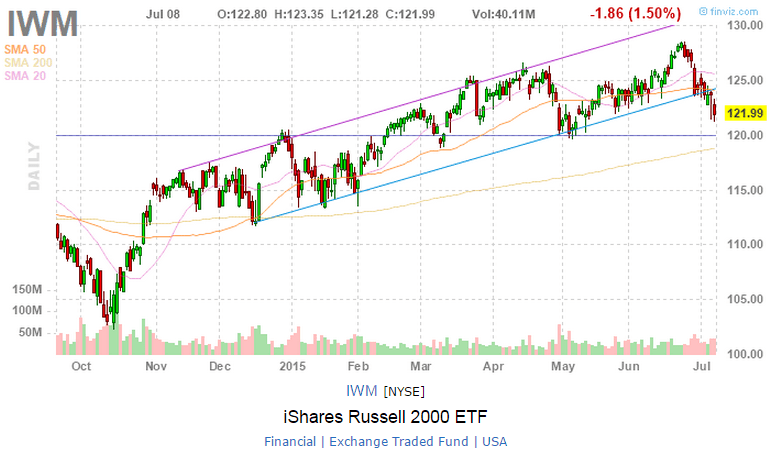
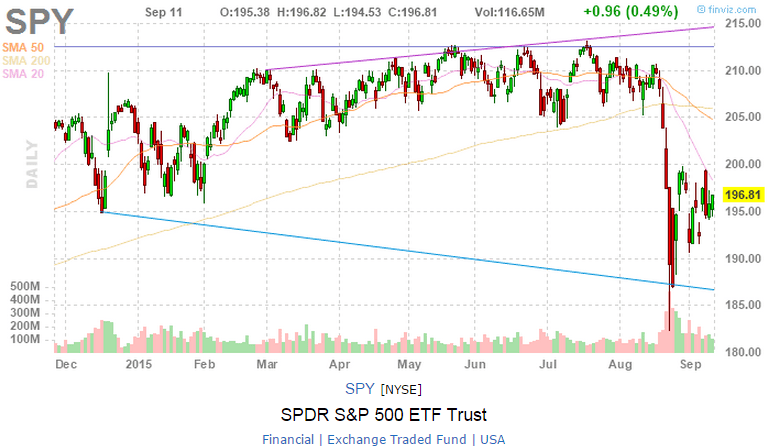
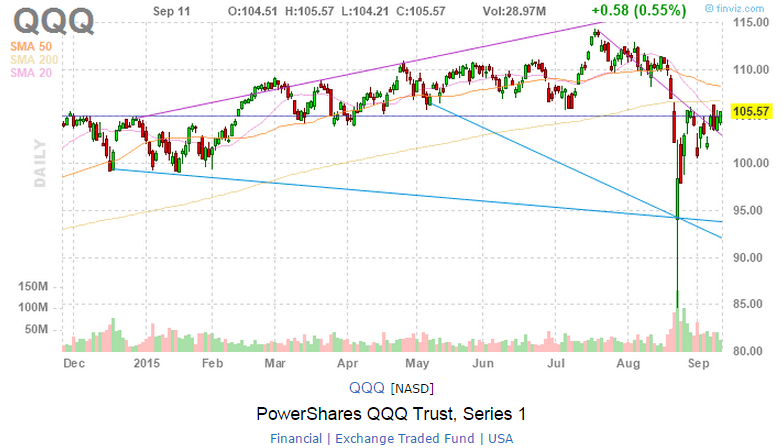
Dow Jones Industrial, S&P500, NASDAQ, Russel 2000 Charts
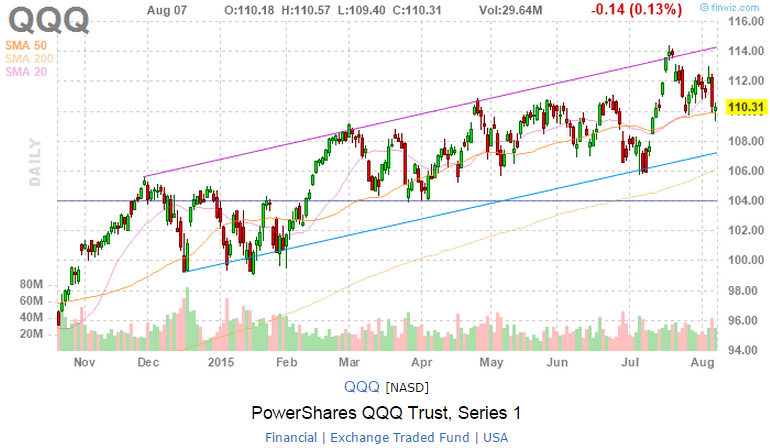
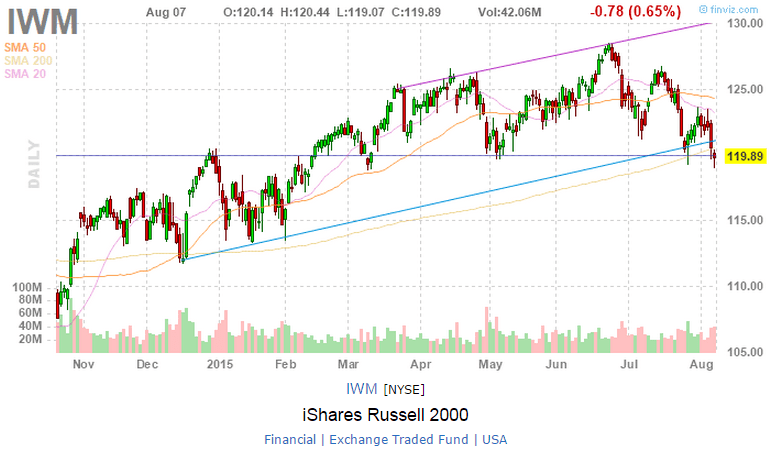
- $INDU, $SPX, $COMPQ, $RUT are currently on official down trend and currently forming a Bearish Pennant. 20D SMA is currently acting as a dynamic resistance. The chart patterns are similar for all 4 indices.
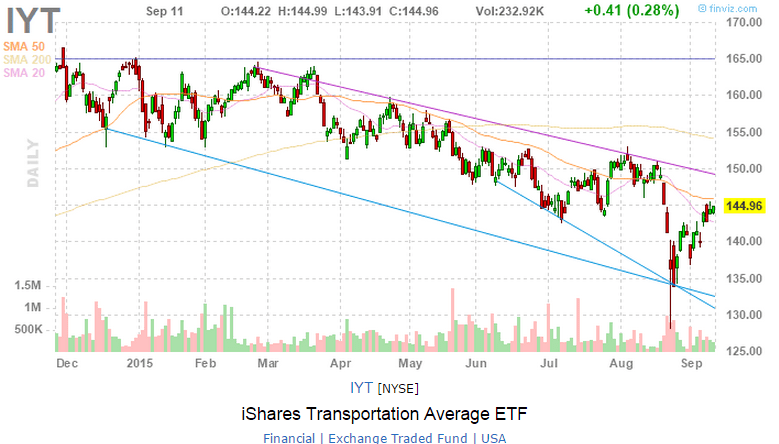
- $TRAN is Dow Jones Transportation Index. The index continues the down trend.
- DIA, SPY, QQQ and IWM are the Indices ETF. IYT is Dow Jones Transportation ETF.


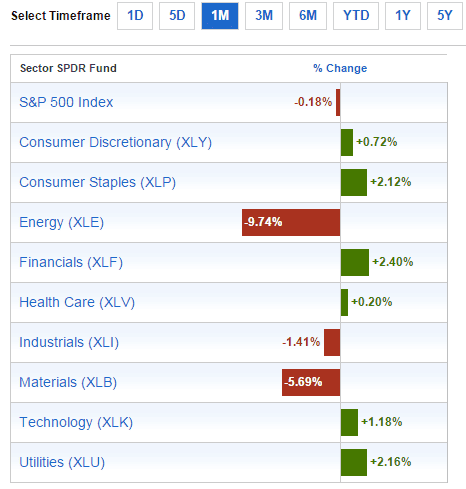
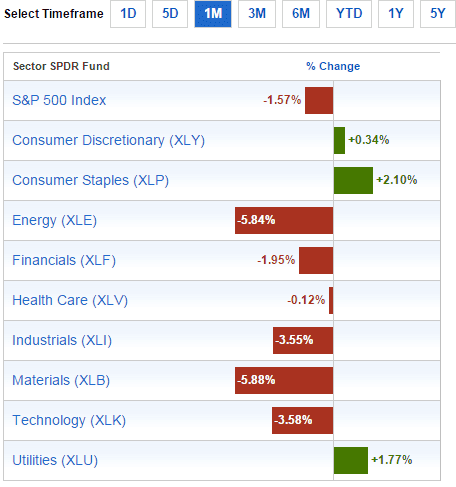
Past 1 Month Sector Performance

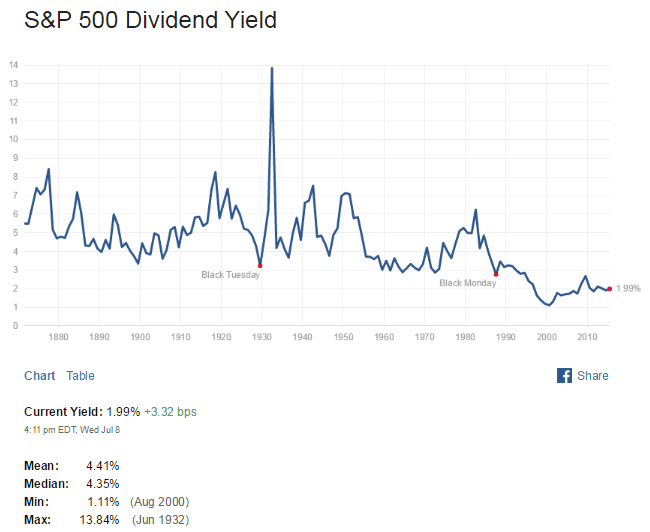
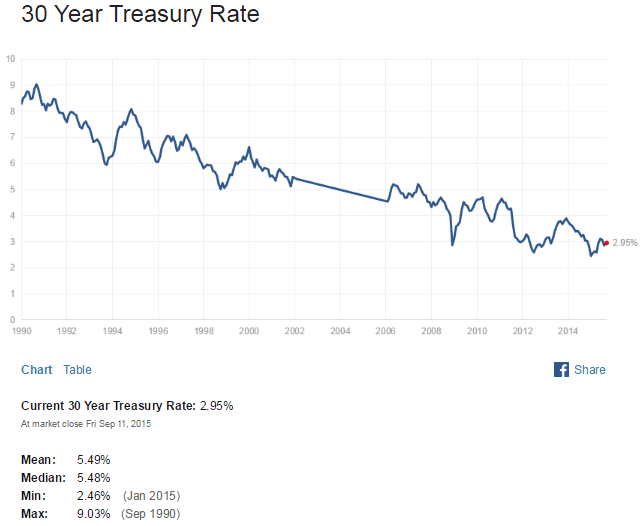
Treasury Yield


Original post by Marubozu https://mystocksinvesting.com