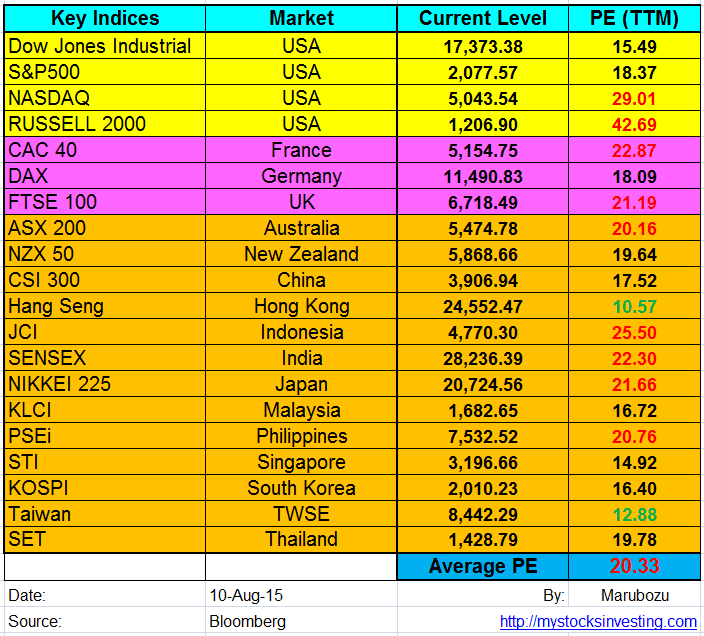
Market Indices PE Ratio for Major Stock Exchange globally
- US: Dow Jones Industrial, S&P500, NASDAQ, Russell 2000
- Europe: FTSE100, CAC40, DAX
- Asia: KLCI, STI, HangSeng, ASX200, CSI 300, JCI, SET, KOSPI, NIKKEI 225, SENSEX, TWSE, NZX50, PSEi
- PE = Price Per Earning
See July 2015 Global Stock Market PE Ratio here.
Average PE ratio remains at 20.33 compare to last month. Most stock market are overvalue now. VIX dropped back to 13.39 after the Greece Debt Default was resolved at the moment. Upside potential is limited base on valuation. Now we need to watch the technical closely and when US Federal Reserve is going to raise interest rate.
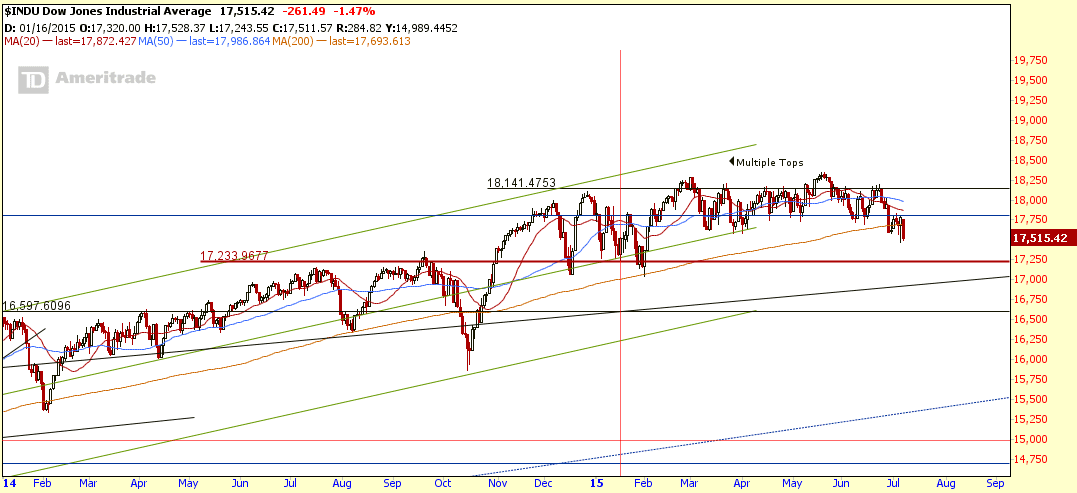
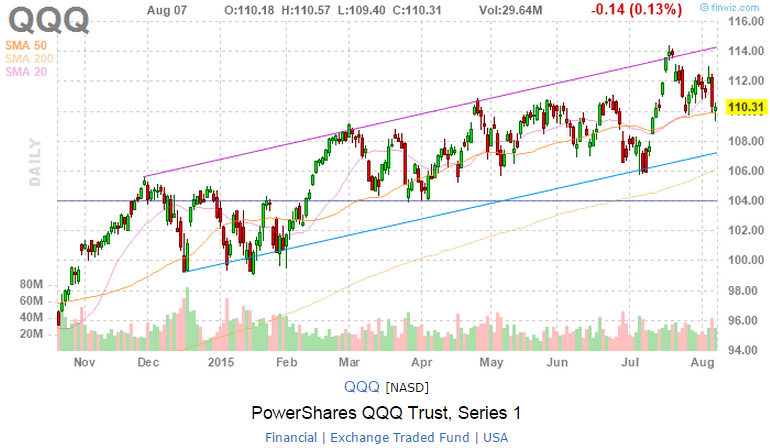
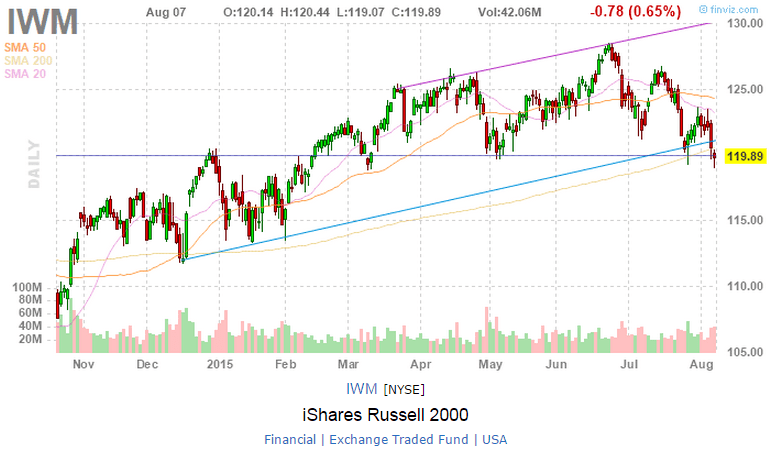
Dow Jones Industrial, S&P500, NASDAQ, Russel 2000 Charts
- $INDU has broken 200D SMA support but may rebound from the support between 17,060 and 17,233. Also take note that this level is also the long term up trend channel support. 17,000 is an important support to watch as all hell may break loose when this support is broken.
- $SPX is currently trading within a Rectangle but just slightly above the 200D SMA support.
- $COMPQ are still on uptrend and immediate support at 5,000 (Long term uptrend support trend line).
- $RUT has broken the 200D SMA support and is currently trading in a down trend channel.
- $TRAN is Dow Jones Transportation Index. The index is currently on the down trend.
- DIA, SPY, QQQ and IWM are the Indices ETF. IYT is Dow Jones Transportation ETF.
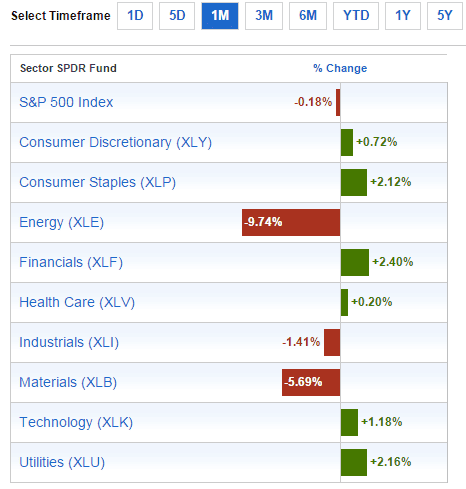
Past 1 Month Sector Performance
Treasury Yield
If you want to understand how to conduct the above stock market analysis (PE Ratio, PB Ratio), how and where to find the free (and right) data from internet, how to analyse the data, how to combine all the analysis to form an own opinion to predict the stock market next moment? How to use the Yield Curve to anticipate the stock market movement. Check out the Fundamental Analysis Class here.

