Global Stock Market Indices PE Ratio At a Glance (2 May 2015)
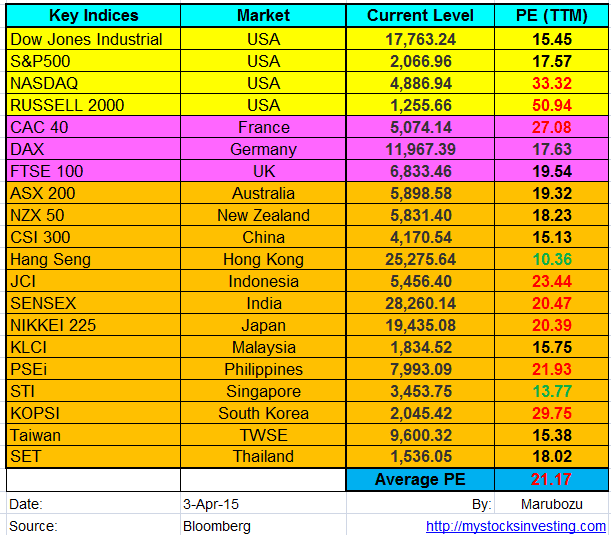
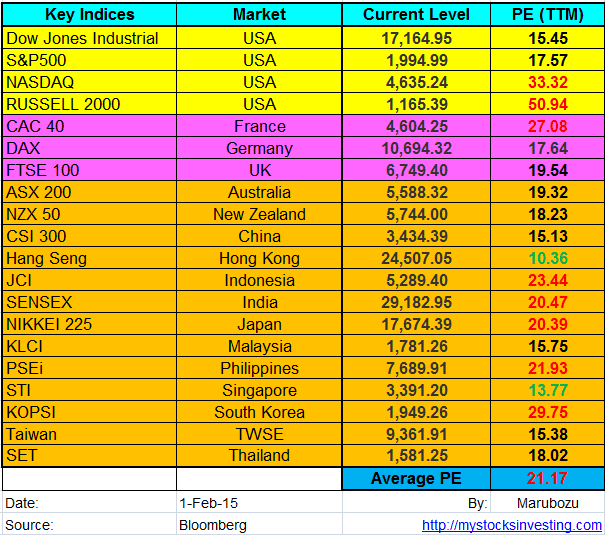
Market Indices PE Ratio for Major Stock Exchange globally
- US: Dow Jones Industrial, S&P500, NASDAQ, Russell 2000
- Europe: FTSE100, CAC40, DAX
- Asia: KLCI, STI, HangSeng, ASX200, CSI 300, JCI, SET, KOPSI, NIKKEI 225, SENSEX, TWSE, NZX50, PSEi
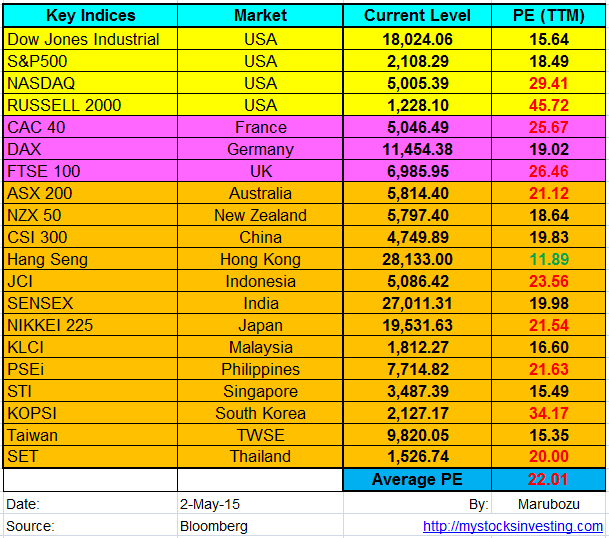
- PE = Price Per Earning
See April 2015 Global Stock Market PE Ratio here.
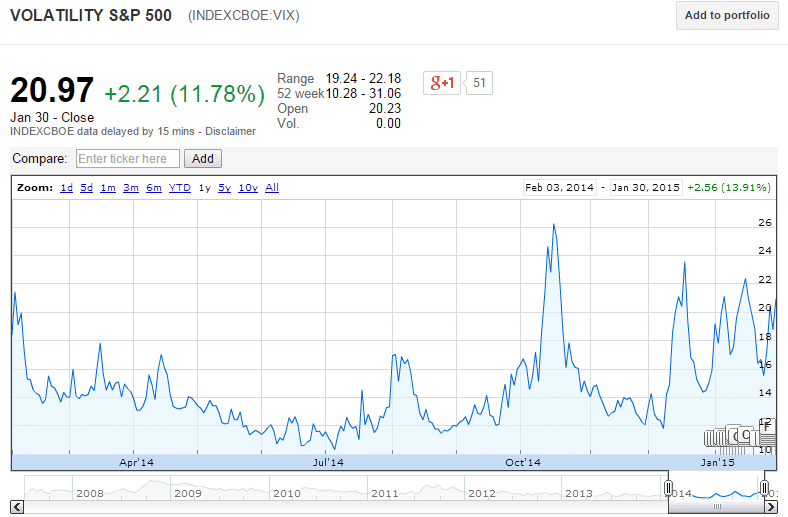
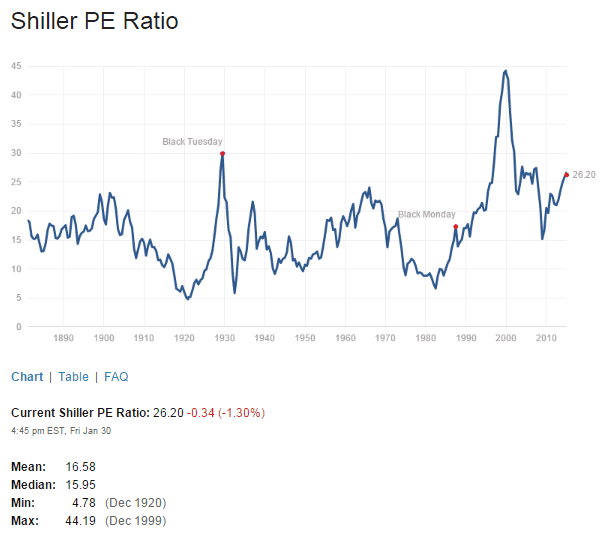
Dow Jones Industrial, S&P500 and NASDAQ are closed to historical high and seems like topping in process. Average PE ratio increases from 21.17 to 22.01. Most stock market are overvalue now. VIX closed at 12.7, a very complacent level moving into May. Watch out for the seasonal pattern – Sell in May and Go away.


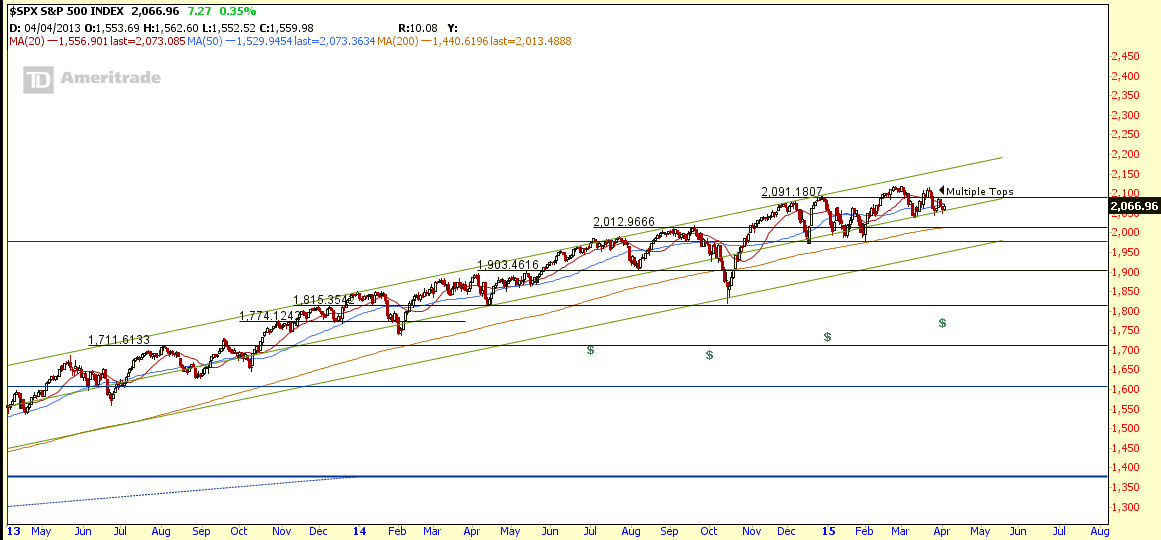
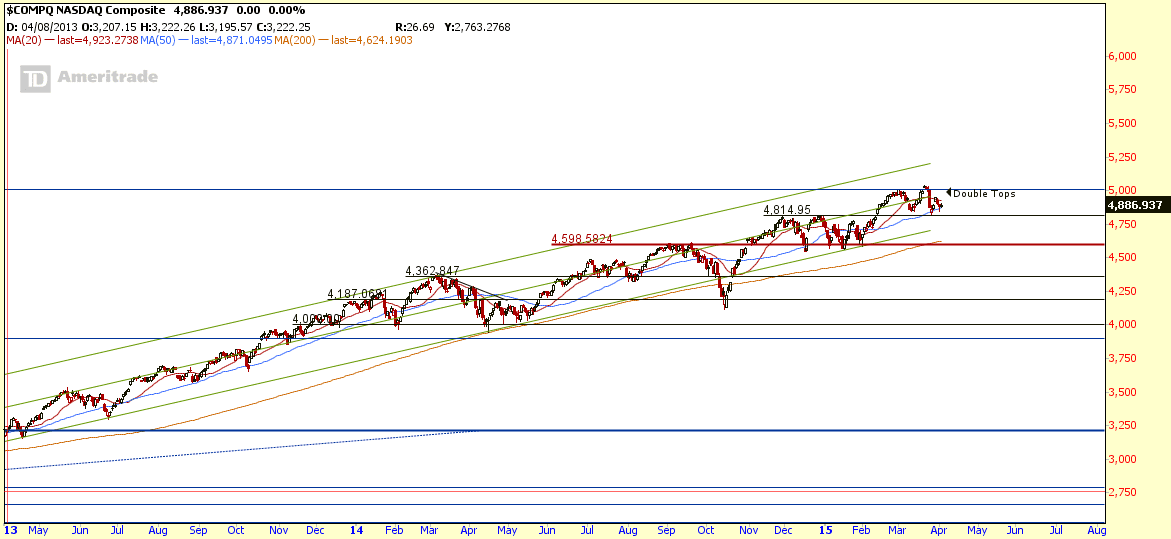
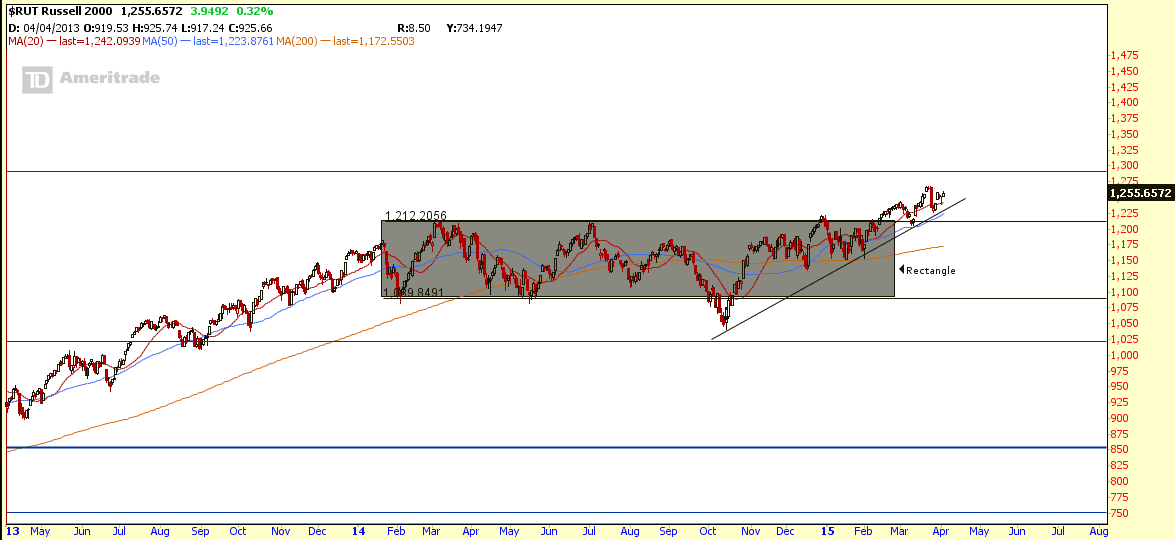
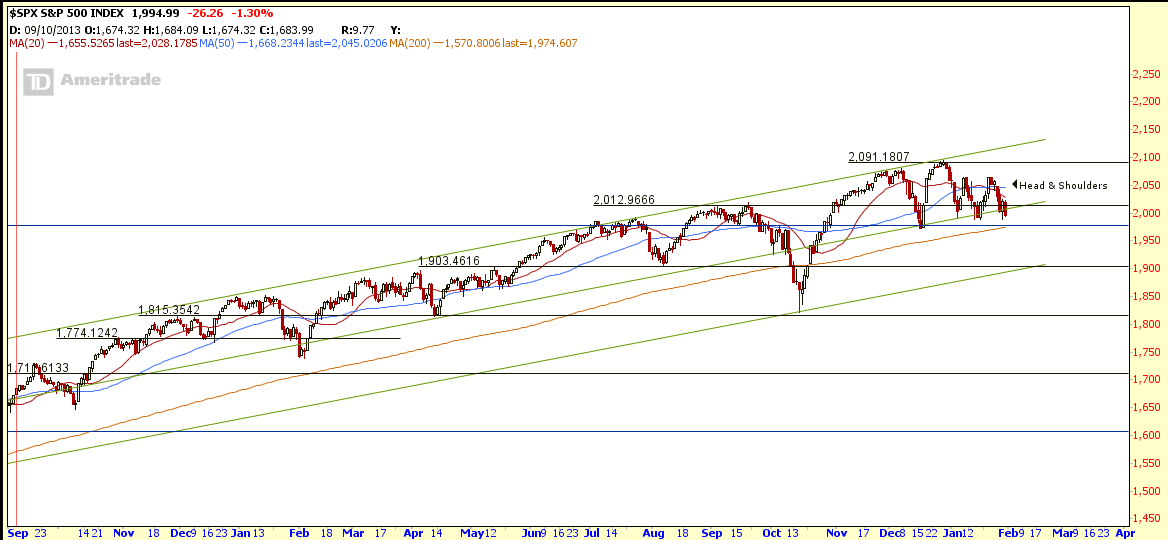
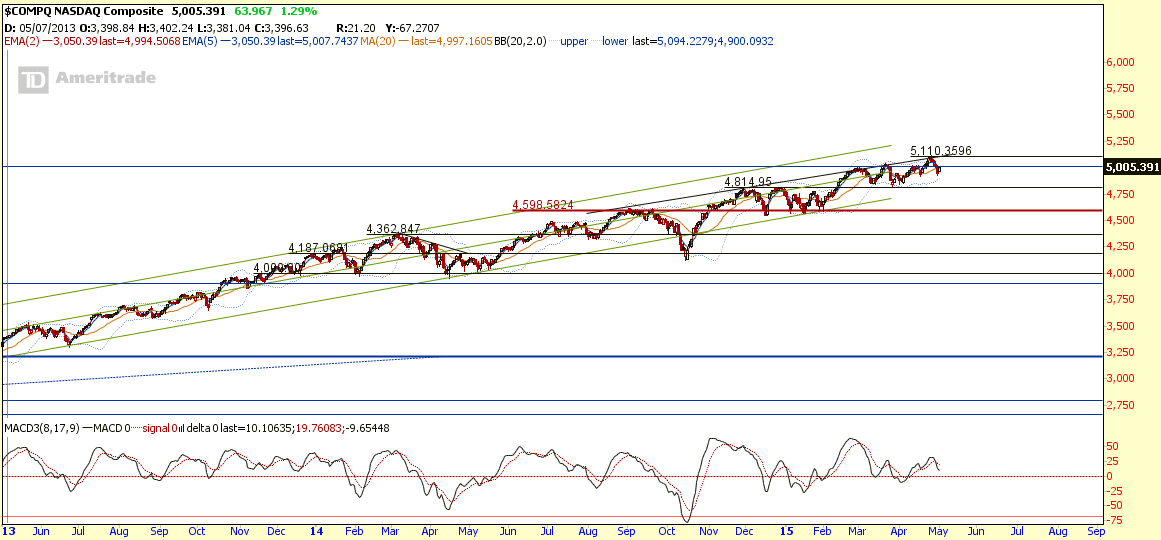
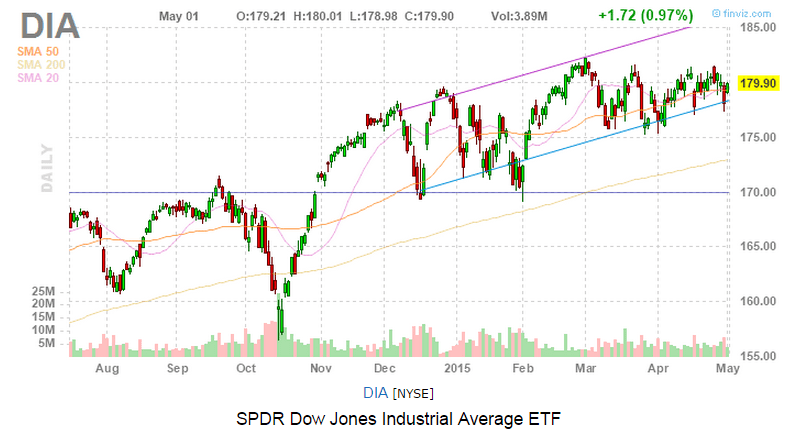
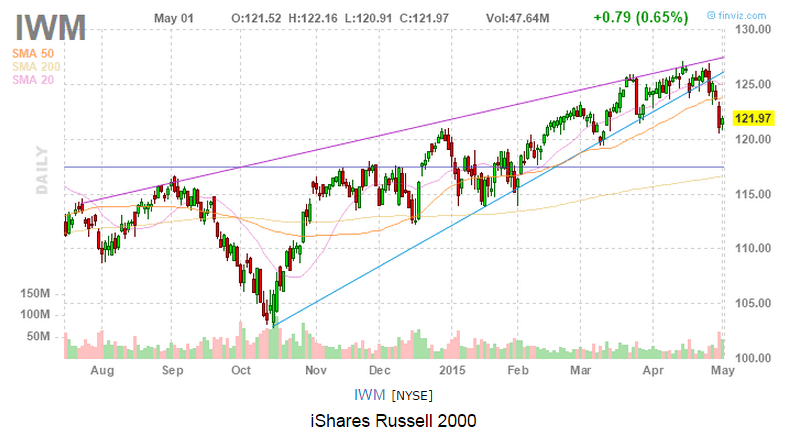
Dow Jones Industrial, S&P500, NASDAQ, Russel 2000 Charts
- INDU, SPX, COMPQ are still on uptrend but showing dangerous reversal chart pattern (multiple tops).
- RUT broke down from a Rising Wedge but just sitting on the resistance turned support level. More down side is this support does not hold.
- DIA, SPY, QQQ and IWM are the Indices ETF.


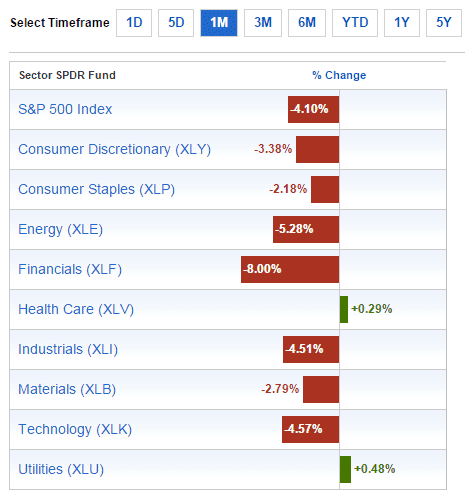
Past 1 Month Sector Performance

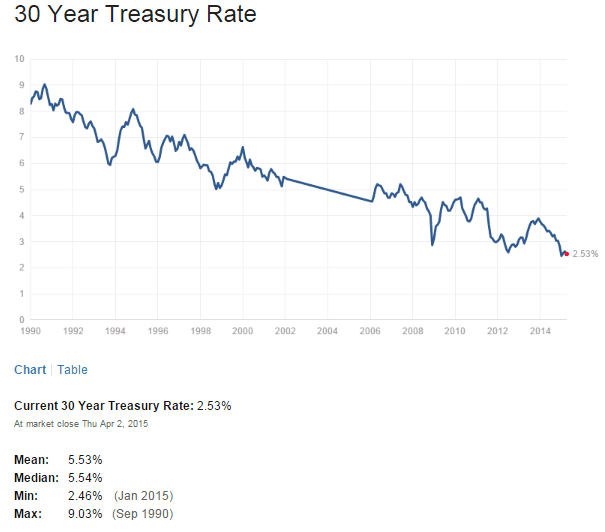
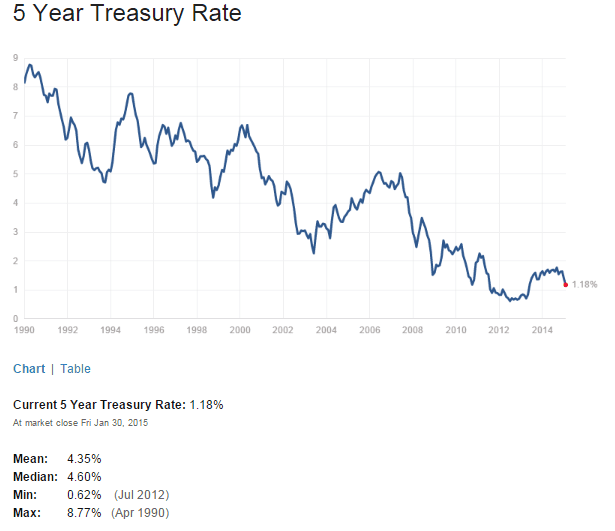
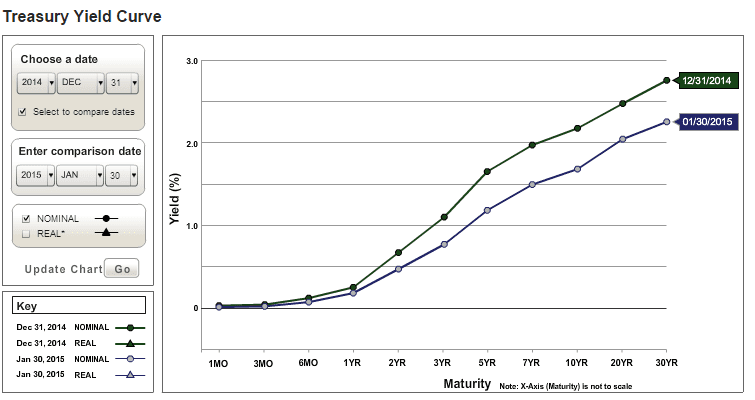
Treasury Yield
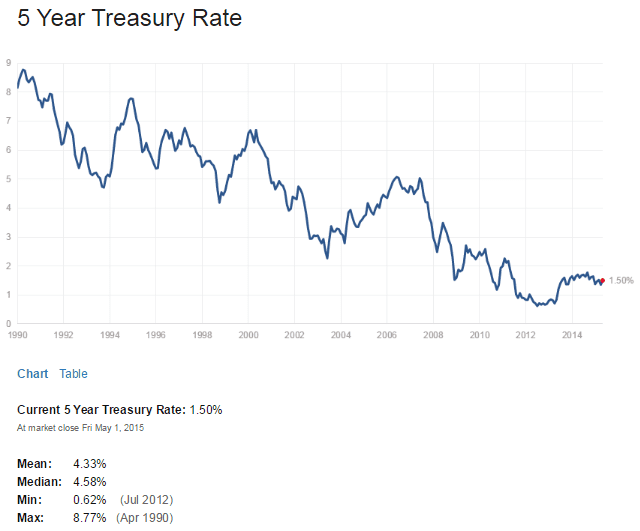

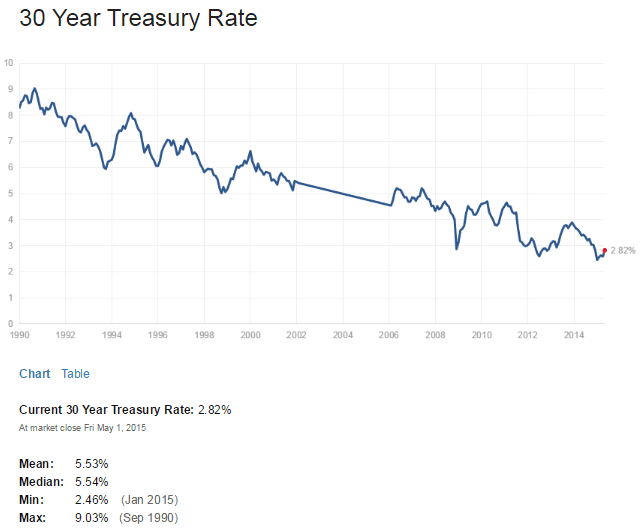

If you want to understand how to conduct the above stock market analysis, how and where to find the free (and right) data from internet, how to analyse the data, how to combine all the analysis to form an own opinion to predict the stock market next moment? How to use the Yield Curve to anticipate the stock market movement. Check out the Fundamental Analysis Class here.