IBM: Breakdown from Rectangle

  • Post author:

Trade Opportunity for IBM after break down from Rectangle which has been in consolidation mode for 2 months! IBM is on confirmed down trend as the stock is trading below 20D, 50D, 200D SMA. MACD Bearish Convergence. 2/5 EMA starts bearish trend.

Technical Analysis for IBM

IBM Dec12-2014

Fundamental Analysis for IBM

IBM Fundamental Analysis Dec12-2014

IBM PE Ratio Dec12-2014

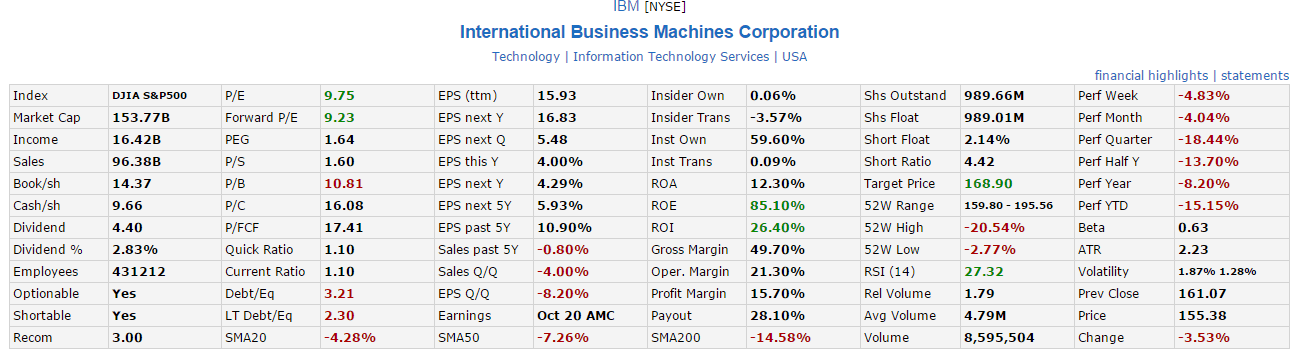
Base on current chart pattern, IBM is suitable for trading. You will be DEAD if you use Value Investing method to invest in IBM now!

Original post by Marubozu from My Stocks Investing Journey.

Continue ReadingIBM: Breakdown from Rectangle

Boeing (BA): Trading Opportunity!

  • Post author:

BA is one of my favorites in option trading. Look at the chart pattern and the swing between high and low! Strategy: Short at Resistance and Long at Support.

BA is getting near to the support. Waiting to take profit for Short position and prepare to setup the next trade.

BA is good for trading but not for investing unless you have very strong heart. You look at the yo-yo wild swing pattern and you will know why.

See previous analysis of Boeing (BA) here.

BA Dec12-2014

Continue ReadingBoeing (BA): Trading Opportunity!

S&P500 ETF (SPY): Expect Correction

  • Post author:

S&P500 ETF (SPY) is currently trading within an uptrend channel but expecting to retrace after hitting the channel resistance.

Current PE for Russell 2000 is 18.2 (over value).

Base on past SPY chart pattern, it is not so easy to trade due to the following:

  • SPY is at historical high, it is risky to long at high.
  • It is also risky to short at the current level because SPY is still on uptrend. It will be a counter trend trade if short at this level.

SPY Dec1-2014

Original post from My Stocks Investing Journey by Marubozu.

Continue ReadingS&P500 ETF (SPY): Expect Correction