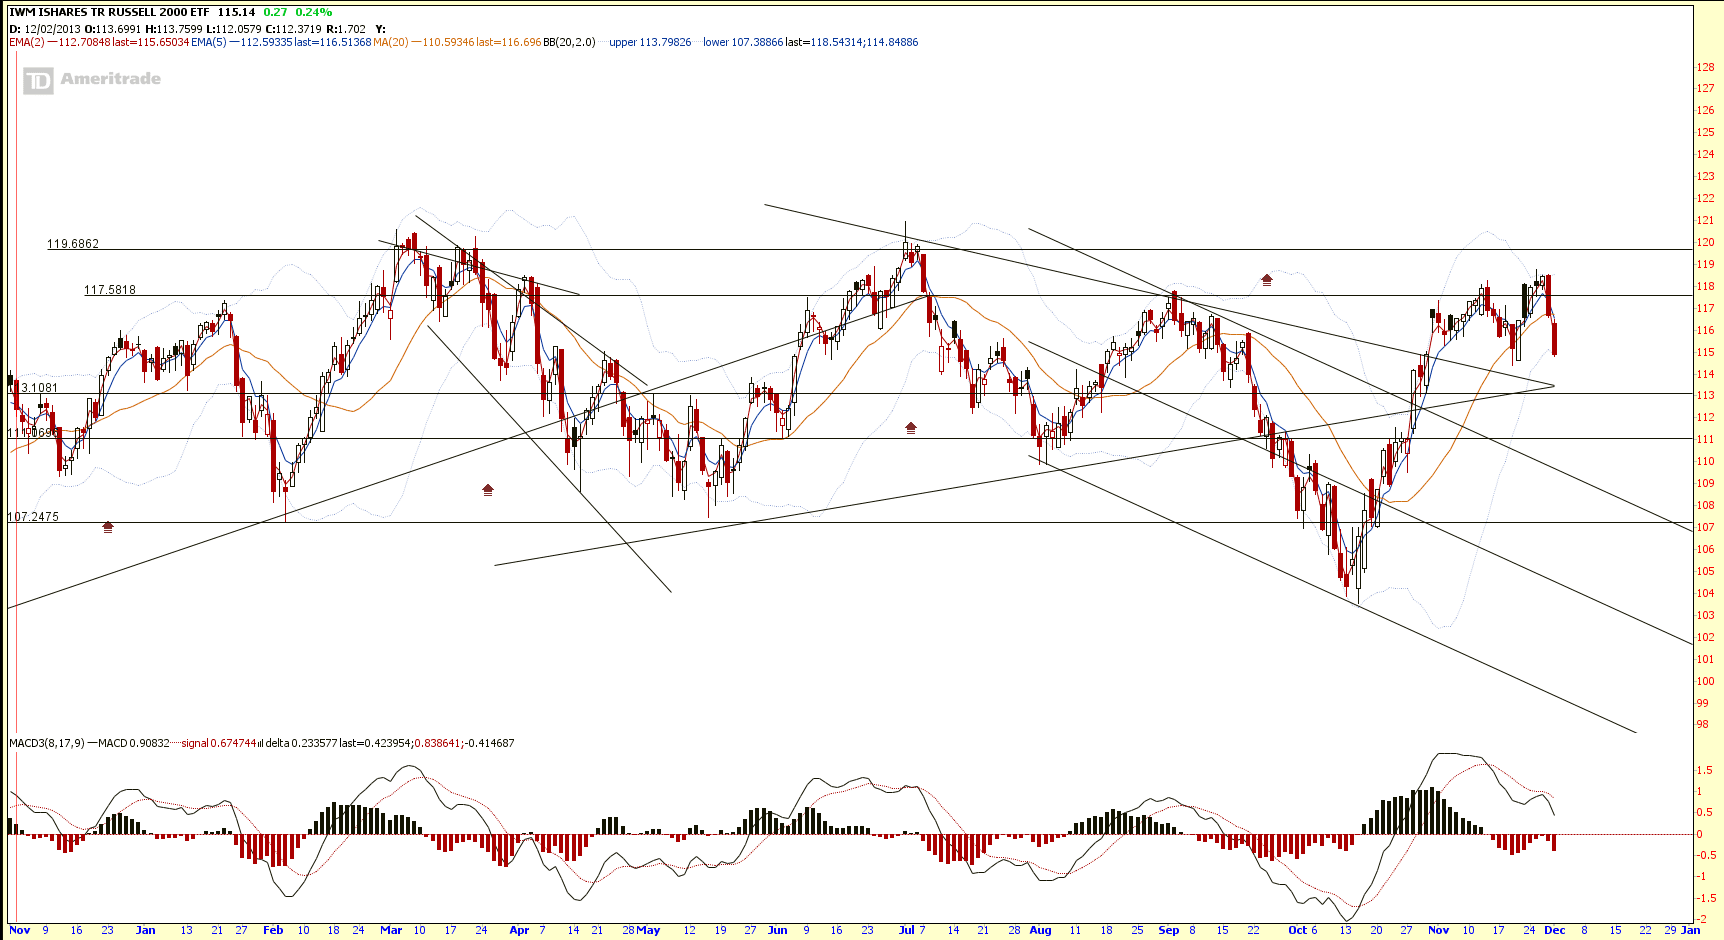
Russel 2000 ETF (IWM): Trend Reversal!
Russel 2000 ETF (IWM) showed a Three Outside Down, reversal pattern, after getting near to the all time high level. Watch out for a start of down trend. 200D SMA support is at $114.
Current PE for Russell 2000 is 50.41 (over value).
Base on past IWM chart pattern, IWM has nice tradeable pattern in two directions (up trend and down trend).
Original post from My Stocks Investing Journey by Marubozu.