Is US Stock Market Forming the Tops?

  • Post author:

No one knows when the US stock market will reach the top. However, the following 4 charts are telling some stories.

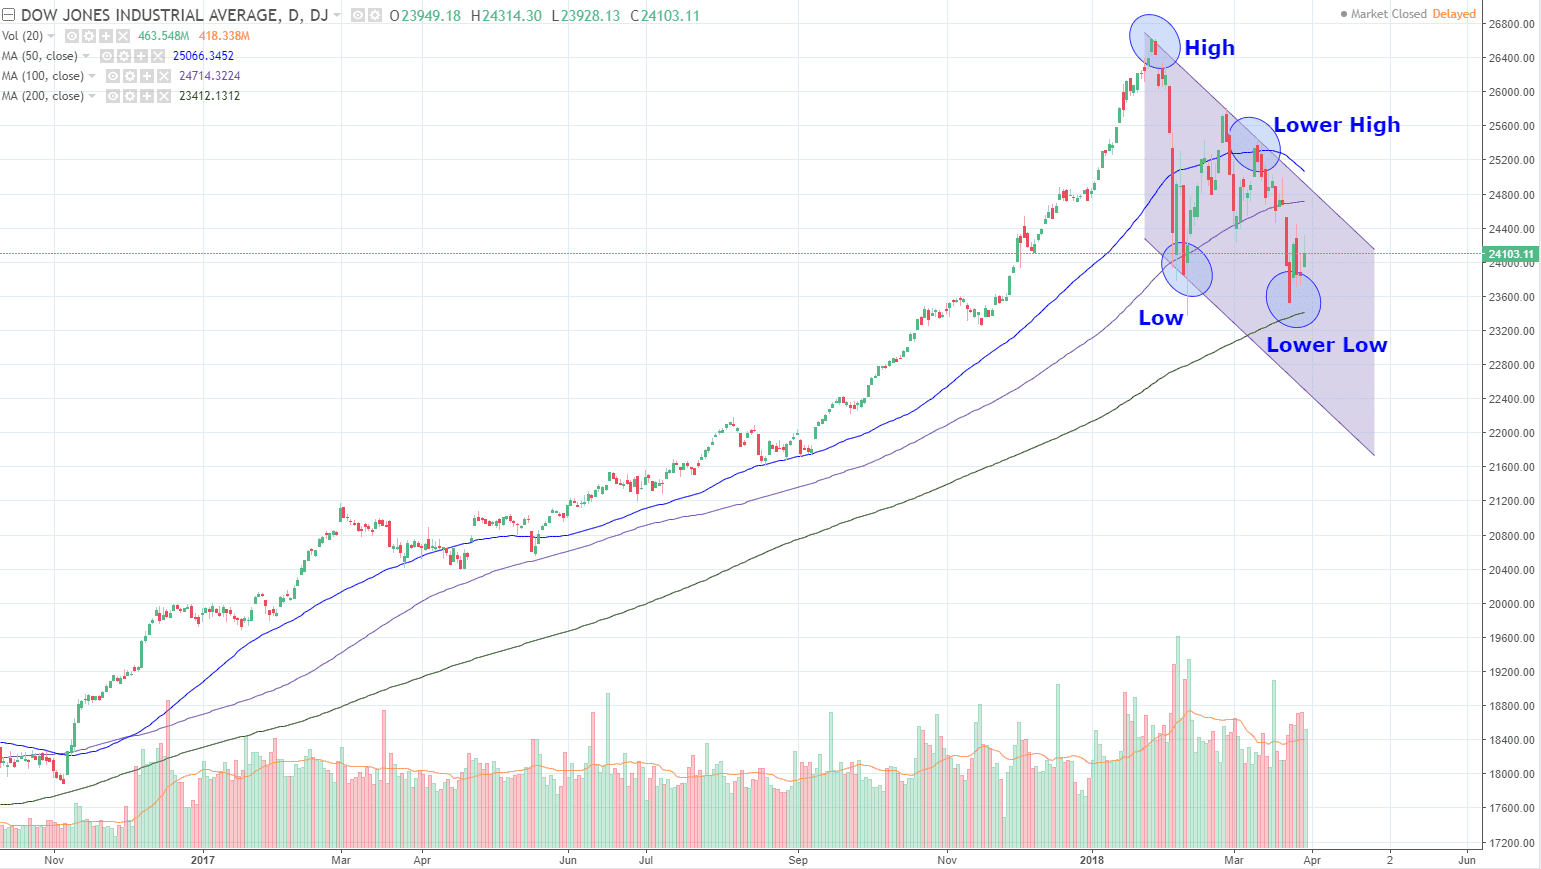
Dow Jones Industrial has already forming a short term “Lower High, Lower Low” bearish down trend channel pattern. Currently the index is only supported by 200D SMA. Long term up trend is still intact as 200D SMA is still sloping up. Is this only a short term correction or long term trend reversal? 200D SMA support is the key!


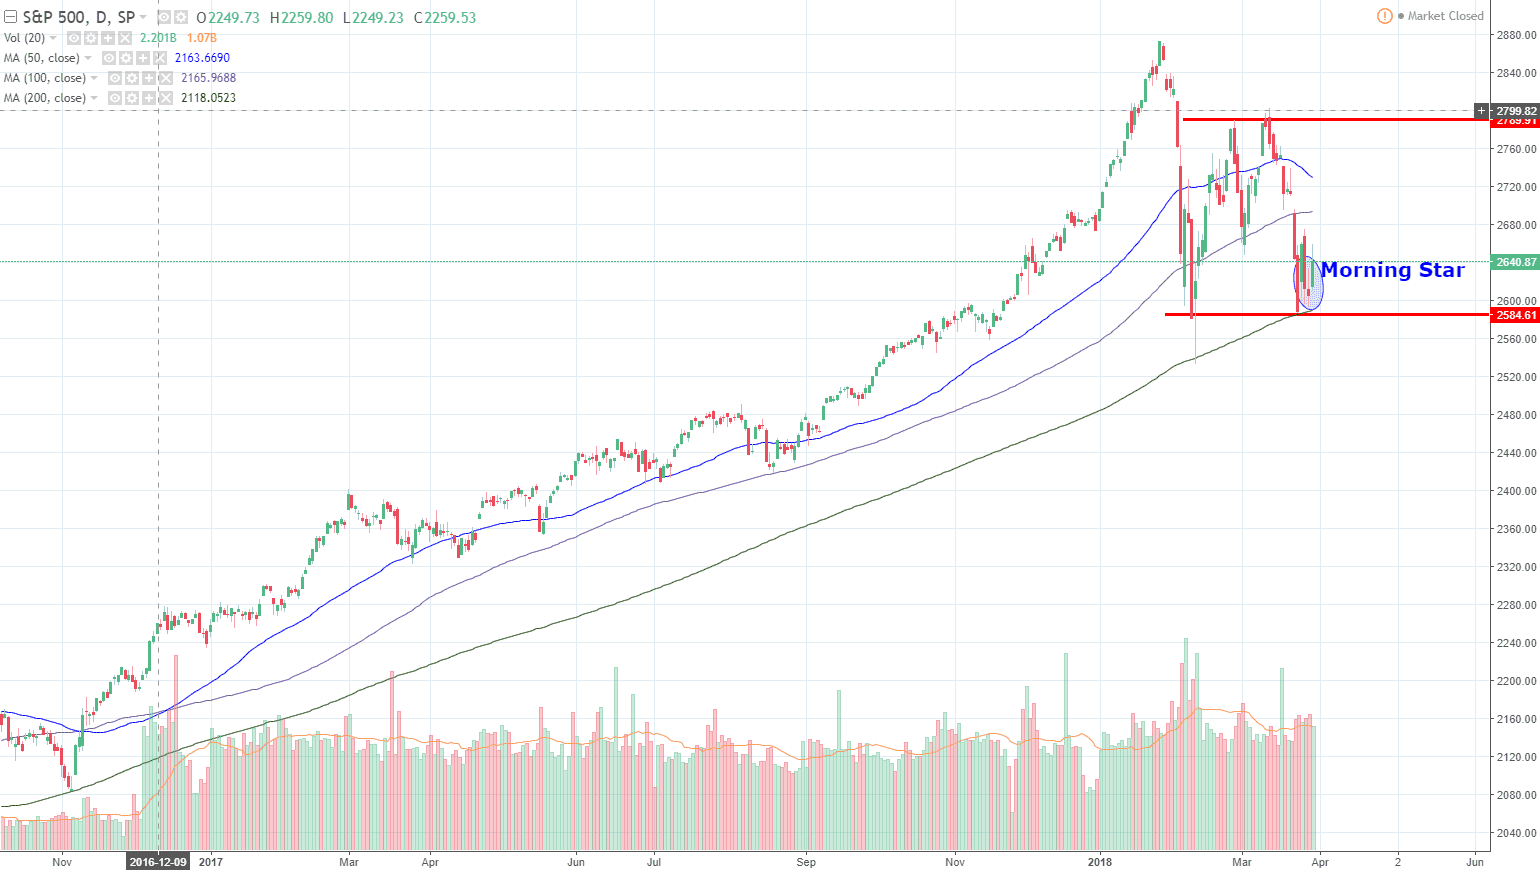
S&P 500 (SPX) is currently trading within a Rectangle consolidation pattern between 2800 and 2584. A Morningstar reversal candlestick was formed at the 200D SMA support indicates a potential rebound entering into the month of April. Long term uptrend is still in tact for SPX as the 200D SMA is still sloping up. Is it a mere correction or long term trend reversal? Watch the 200D SMA support!


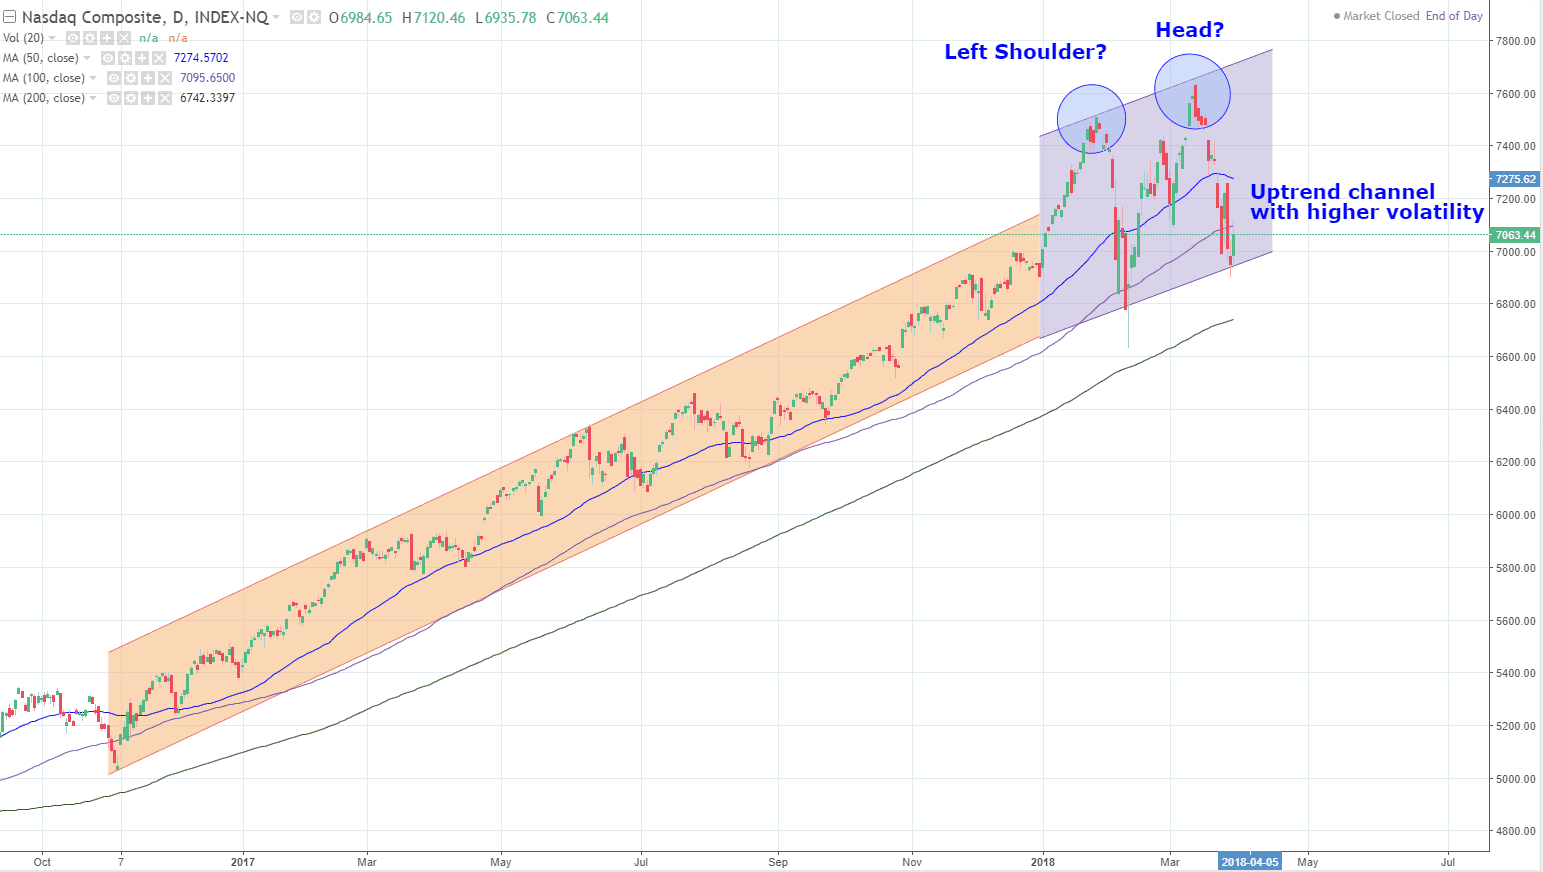
NASDAQ is still trading within an uptrend channel but volatility has increased since beginning of year 2018. NASDAQ is currently rebounded from the uptrend channel support. Keep a closed eye to see whether NASDAQ forms a Head and Shoulders reversal pattern or continue its uptrend.


Russel 2000 (RUT) has formed a Double Tops and currently is trading close to the uptrend support at about 1,511 and next support is at 200D SMA (about 1, 480). If these 2 supports are broken, the uptrend of RUT will be ended. If RUT breaks 1,607 resistance, more upside is expected. RUT long uptrend is still intact based on 200D SMA slope. 50D and 100D slope may be turning down.

Continue ReadingIs US Stock Market Forming the Tops?

Weekly Inter Market Analysis Jan 15-2017

  • Post author:

See previous week Weekly Inter Market Analysis.

Original post from https://mystocksinvesting.com

SPY (SPDR S&P500 ETF)

SPY is trading within a very tight range between the all time high resistance of 227.75 resistance and immediate support at 223.  Probably will see the breakout this week after Donald Trump inauguration as US President.

  • Immediate resistance at 227.75
  • Immediate support: about 223
  • Previous resistance turned support zone: about 219-220.
  • 200D SMA support (trending up): about 214

VIX

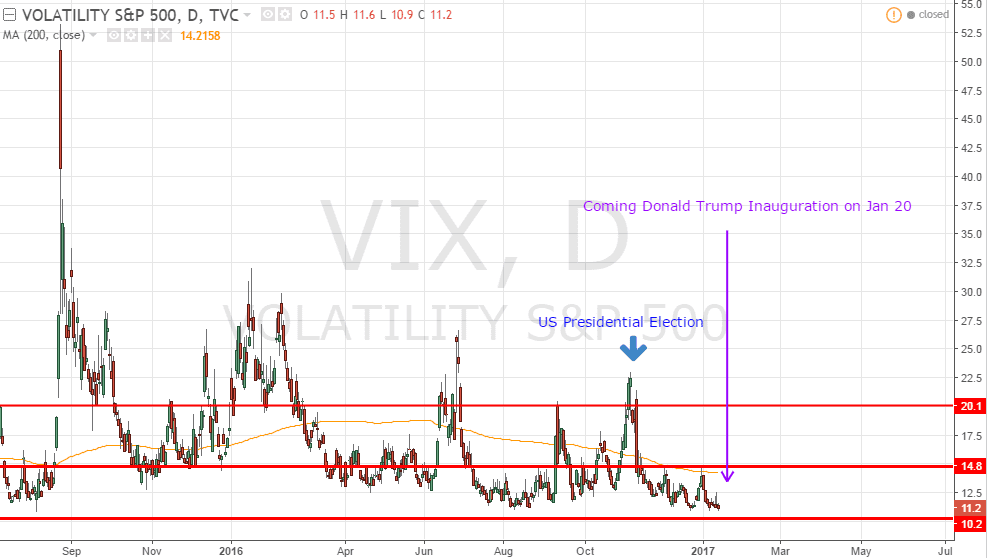
VIX continues to stay within the complacent zone at 14.0. No fear entering into 2017. The inauguration of Donald Trump as the 45th President of the United States will be held on Friday, January 20, 2017. Let’s see whether the market is worried about what he is going to say, and prepared for the shock!


Sector Performance (SPDR Sector ETF)

  • Best Sectors: Consumer Discretionary (XLY) +0.77%
  • Worst Sector: Real Estate (XLRE) -2.26%


SUDX (S&P US Dollar Futures Index)

SUDX retraced from resistance at about 138 and currently testing the uptrend support (in green). Let see whether SUDX will rebound from this level or continue to move down. The trend remains up for US Dollar.

FXE (Currency Shares Euro ETF)

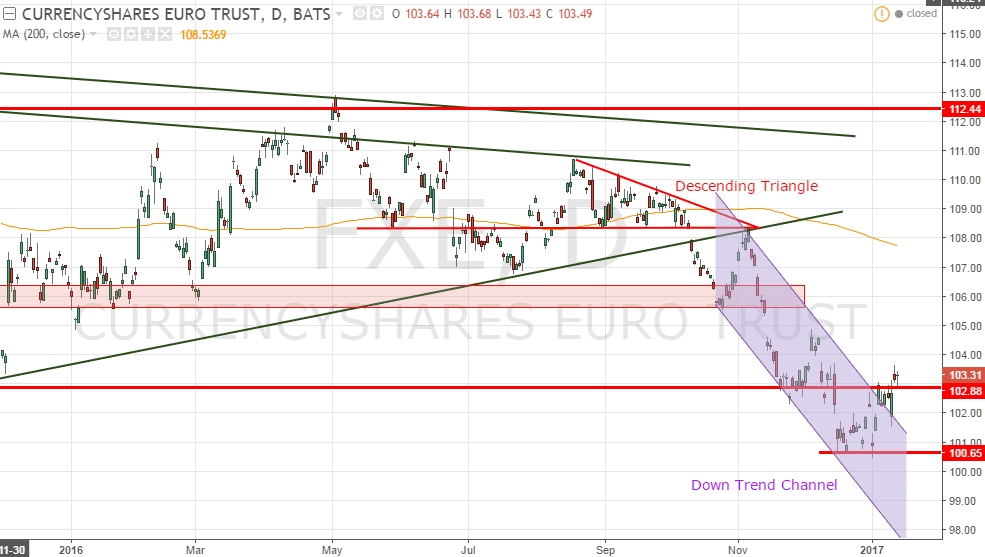
FXE is still testing the channel resistance and also the support turned resistance level (horizontal red line) at about 102.88. Expect more down ward pressure for FXE if rejected at this resistance.


XLE (SPDR Energy Sector ETF)

XLE is currently retracing to test the support at 74.87. Breaking this support will probably send XLE to the next support level of 71.84.


USO (United States Oil Fund)

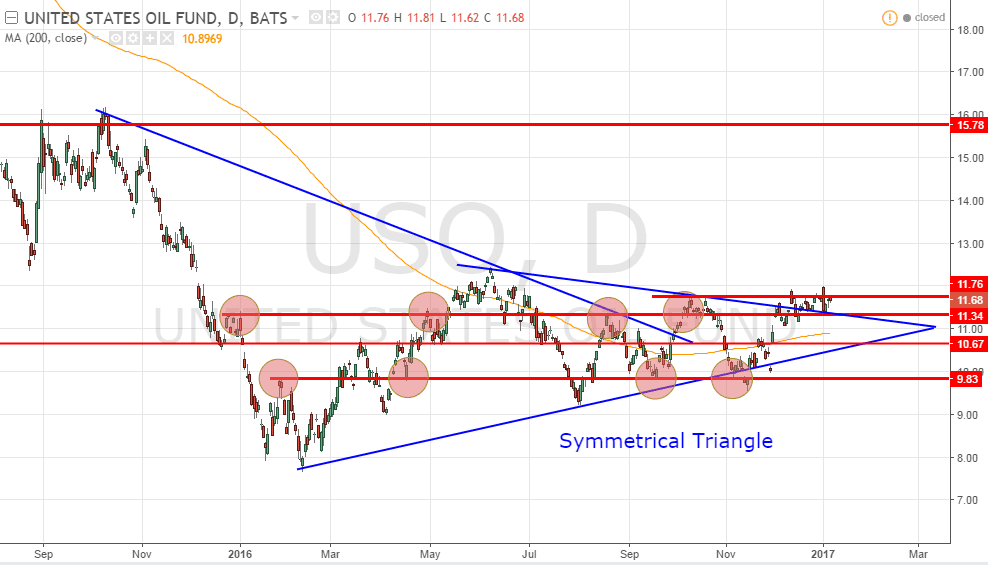
USO is currently facing the rectangle resistance zone. USO is still trading side way until a more convincing breakout. Opportunity for bullish trade when USO breaks out upward from this consolidation range.


TLT (iShares 20+ Years Treasury Bond ETF)

TLT is finding support at 117-118 and is current rebounding. Next resistance zone about 127-128 at 38.2% Fibonacci Retracement level and also the previous support turned resistance. The trend remains down for TLT.


GLD (SPDR Gold Shares)

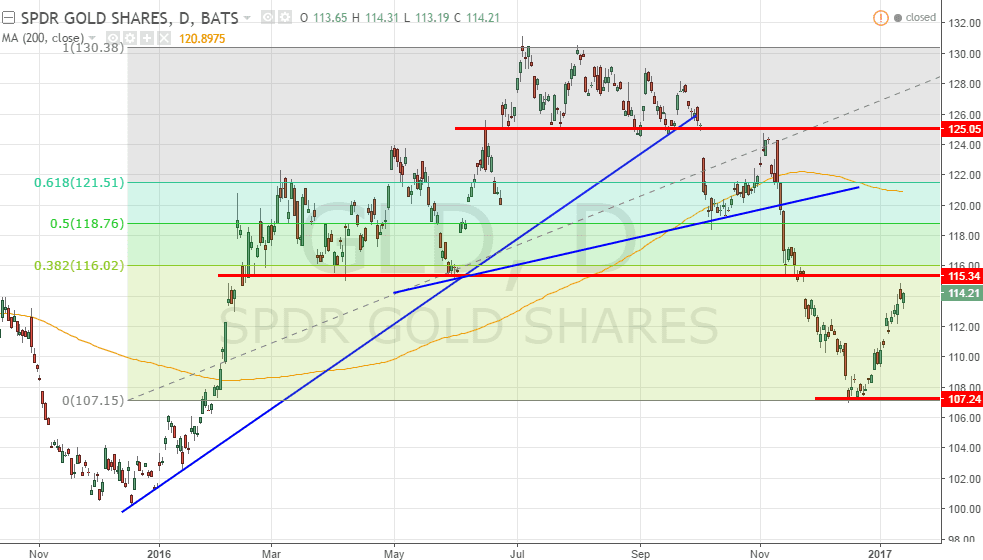
GLD is getting near to the next resistance zone about 115-116 at 38.2% Fibonacci Retracement level and also the previous support turned resistance. Watch out for the reversal patterns. The trend remains down for GLD.

Next Week Economic Calendar

Key events:

  • ECB Press Conference on Jan 19 (Thursday)
  • Janet Yellen speaks on Jan 19 (Thursday) and Jan 20 (Friday)
  • Crude Oil Inventories on Jan 20 (Friday)

See upcoming Events here. https://mystocksinvesting.com/events/


Weekly Market Summary.


Continue ReadingWeekly Inter Market Analysis Jan 15-2017

Weekly Inter Market Analysis Jan 8-2017

  • Post author:

See previous week Weekly Inter Market Analysis.

Original post from https://mystocksinvesting.com

SPY (SPDR S&P500 ETF)

Profit taking after SPY reached the all time high of 227.75 entering into 2017.  SPY immediately rebounded after a small retracement back to 223 support. A healthy retracement is needed for SPY to move higher. Take note that bullish seasonal cycle between Nov to April.

  • Immediate resistance – 227.75
  • Immediate support: about 223
  • Previous resistance turned support zone: about 219-220.
  • 200D SMA support (trending up): about 214


VIX

VIX continues to stay within the complacent zone at 14.0. No fear entering into 2017. The inauguration of Donald Trump as the 45th President of the United States will be held on Friday, January 20, 2017. Let’s see whether the market is worried about what he is going to say, and prepared for the shock!


Sector Performance (SPDR Sector ETF)

  • Best Sectors: Healthcare (XLV) +2.92%
  • Worst Sector: Nil


SUDX (S&P US Dollar Futures Index)

SUDX is currently facing resistance at about 138 and currently take a breather. The trend remains up for US Dollar.


FXE (Currency Shares Euro ETF)

FXE rebounded from the support at around 100.65 but is still trading within a down trend channel.  FXE is currently testing the channel resistance and also the support turned resistance level (horizontal red line) at about 102.88. Expect more down ward pressure for FXE if rejected at this resistance.


XLE (SPDR Energy Sector ETF)

XLE is currently retracing and forming a Bullish Pennant after hitting the recent high of 78.34. If XLE can find the support at 74.87 or 71.84, the bull has strength to move XLE higher.


USO (United States Oil Fund)

USO is currently facing the rectangle resistance zone. USO is still trading side way until a more convincing breakout. Opportunity for bullish trade when USO breaks out upward from this consolidation range.


TLT (iShares 20+ Years Treasury Bond ETF)

TLT is finding support at 117-118 and is current rebounding. Fibonacci Retracement level is redrawn to find next potential resistance. Next resistance zone about 127-128 at 38.2% Fibonacci Retracement level and also the previous support turned resistance. The trend remains down for TLT.


GLD (SPDR Gold Shares)

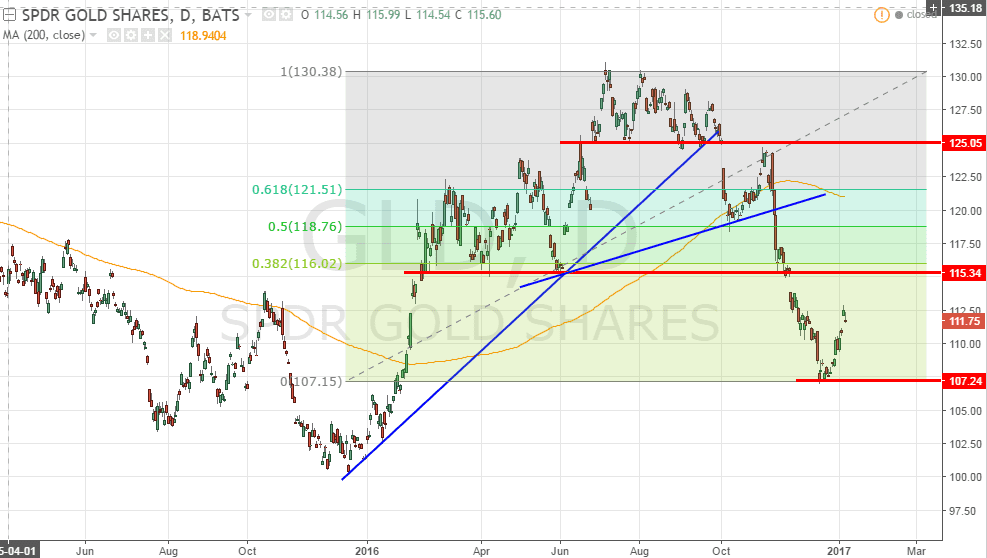
GLD is rebounding from the support at about 107 after the huge sell off. Fibonacci Retracement level is redrawn to find next potential resistance. Next resistance zone about 115-116 at 38.2% Fibonacci Retracement level and also the previous support turned resistance. The trend remains down for GLD.

Read the article on Ringing in the New Year with a Bullish Case for Gold here.

Next Week Economic Calendar

Key events:

  • Crude Oil Inventories on Jan 12 (Thursday)
  • Janet Yellen speaks on Jan 13 (Friday)

See upcoming Events here. https://mystocksinvesting.com/events/


Weekly Market Summary.


Continue ReadingWeekly Inter Market Analysis Jan 8-2017