Most of us are spending most of our life time in Creating Wealth (Setting Up Business), Accumulating Wealth (through Investing) and Protecting Wealth (Buying Insurance) but always forget about Wealth Distribution after our Death. Recently I have attended a Estate Planning Seminar and started to understand the complexity of our Wealth Distribution after our death. If we don’t decide how we want to pass on our wealth to our loved one, the government will decide and distribute for us through Intestate Succession Act.

..
Intestate Succession Act – Distribution Without a Will

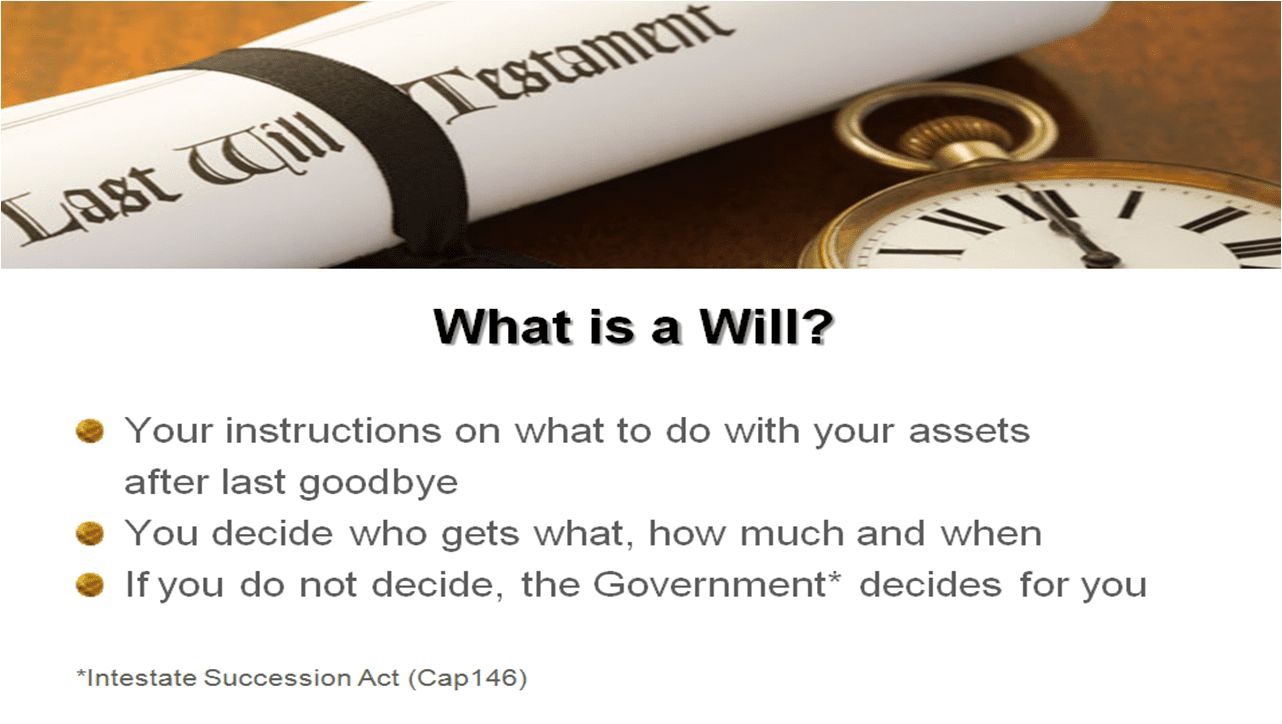
What is Will?
Common Questions to Ask When Planning the Wealth Distribution After Our Death
- Who will be our Beneficiaries (Spouse, Young Children, Aging Parents, etc)?
- How are we distributing movable assets (Cash, Shares) and Inmovable Assets (Properties)?
- Who will be the Guardians if we are perished in a common accident and leave behind our minor children?
- Who will be the our Executors to distribute our Wealth according to our Will?
- How to keep my Will at a safe place and not get lost?
Read related post How Your Asset to be Distributed without a Will?
REGISTER to attend a free Estate Planning Seminar here.


