Singapore REIT Fundamental Analysis Comparison Table – 4 June 2017
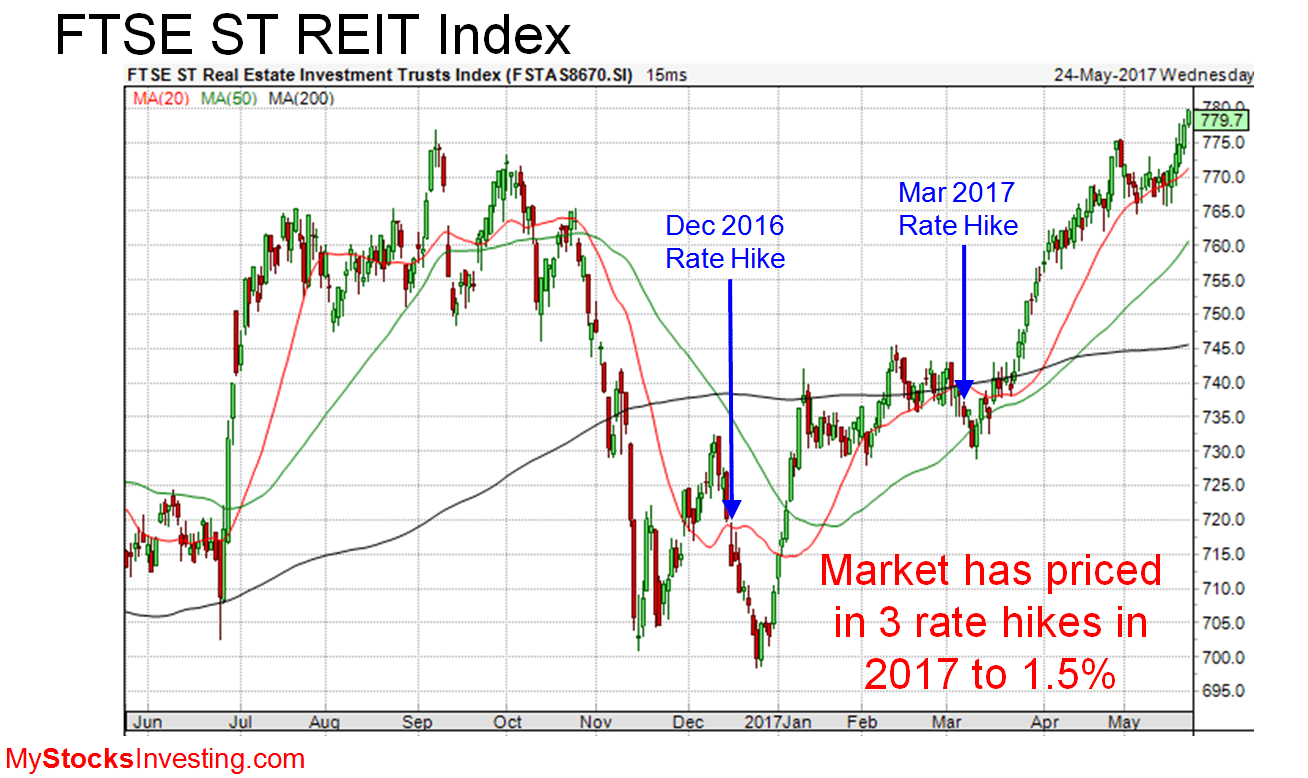
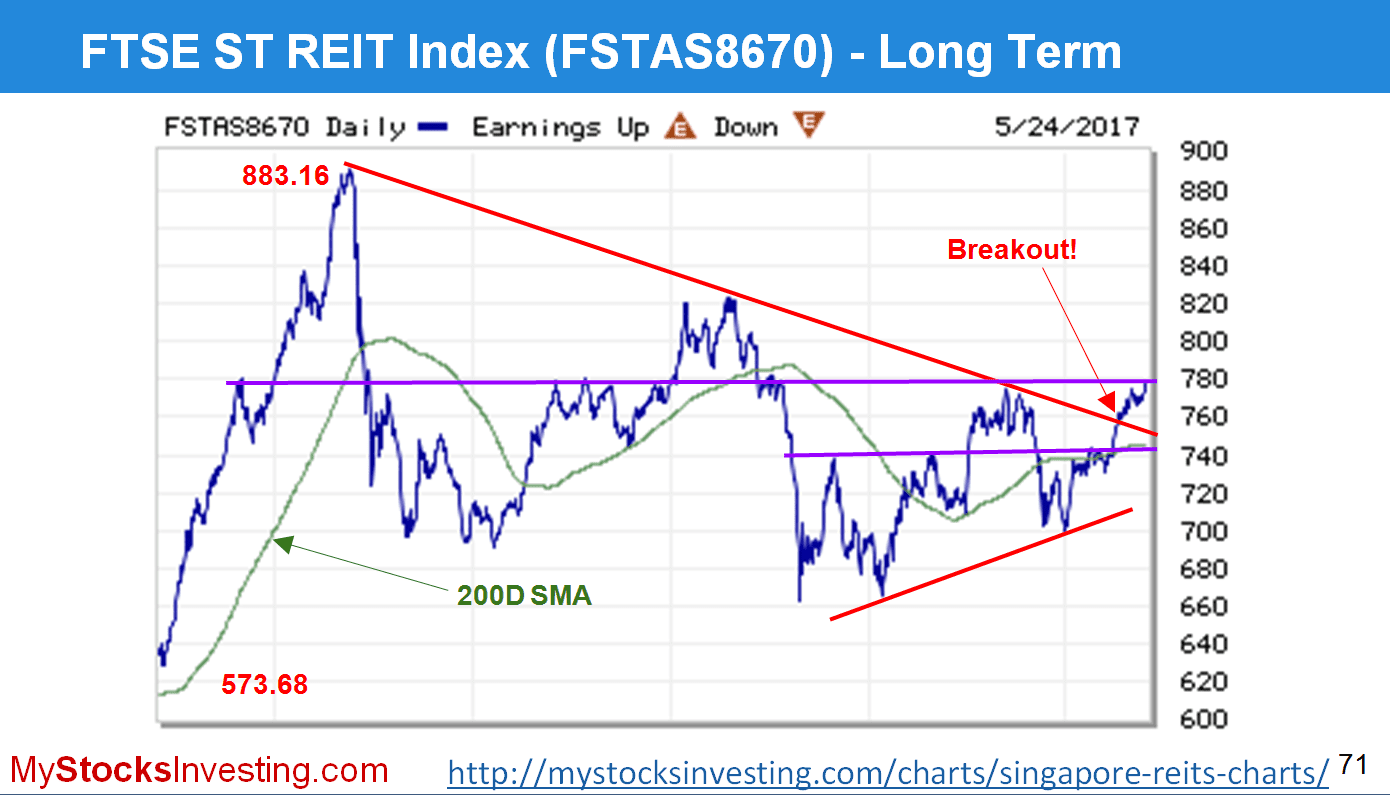
FTSE ST Real Estate Investment Trusts (FTSE ST REIT Index) increases from 766.21 to 788.29 (+2.88%) ( compare to last post on Singapore REIT Fundamental Comparison Table on May 7, 2017. The index has broken out from the strong resistance at about 780. This is a very bullish signal for Singapore REITs as a whole.
See previous Singapore REITs Index Chart and Technical Analysis here.

- Price/NAV increases from 0.99 to 1.02 (Singapore Overall REIT sector is at fair value now).
- Distribution Yield decreases from 6.83% to 6.67% (take note that this is lagging number). Less than half of Singapore REITs (13 out of 37) have Distribution Yield > 7%. High yield REITs mainly from Hospitality Trust and small cap Industrial REIT, but we must understand the risks while chasing for the high yield. Check out How to spot those Fundamentally strong REIT with attractive yield to build up a Passive Income Portfolio?
- Gearing Ratio decreases from 35.10% to 35.0%. 22 out of 37 have Gearing Ratio more than 35%. In general, Singapore REITs sector gearing ratio is healthy.
- Most overvalue is Parkway Life (Price/NAV = 1.52), FIRST REIT (Price/NAV = 1.31) and Keppel DC REIT (Price/NAV = 1.35).
- Most undervalue (base on NAV) is Sabana REIT (Price/NAV = 0.71), followed by Far East HTrust (Price/NAV = 0.73), Fortune REIT (Price/NAV = 0.74) and Keppel REIT (Price/NAV = 0.78)
- Highest Distribution Yield (TTM) is Sabana REIT (9.86%), followed by Viva Industrial Trust (8.59%), SoilBuild BizREIT (8.67%) and Cache Logistic Trust (8.51%). All 4 REITs are small cap from Industrial sector.
- Highest Gearing Ratio is Cache Logistic Trust (43.1%), iREIT Global (42.1%) and Ascott REIT (41.1%)

Disclaimer: The above table is best used for “screening and shortlisting only”. It is NOT for investing (Buy / Sell) decision. To learn how to use the table and make investing decision, Sign up next REIT Investing Seminar here to learn how to choose a fundamentally strong REIT for long term investing for passive income generation.
Fundamentally the whole Singapore REITs is at its fair value in average. There are also sign of recovery in Office and Hospitality sectors where the quarterly DPU has started to increase again. See Office Sector Bubble Charts and Hospitality Sector Bubble Charts here.
Technically Singapore REITs is on bullish up trend and is expected to move higher after breaking out from the strong resistance last Friday.
I was invited by City Index to share Singapore REITs Market Outlook seminar on May 25, 2017 Sharing at TKP Conference Center, Raffles Place. One of the most common questions asked is whether retail investors MISS THE BOAT in this REITs run up. My answer is YES base on the response from the audience because many retail investors are sitting on the sideline after reading all the gloomy economic news, over supply of properties in Singapore and fear of interest rate hikes. Most retail investors do not take any action due to fear but smart money already moved into Singapore REITs sector due to attractive valuation and distribution yield a few months ago.

I expect the bullish trend to continue in Singapore REITs but there are not many opportunities in big cap REITs as they have moved up too fast and some of the valuation / yield are no longer attractive. The next opportunities are probably in under value sectors and small cap REITs. However, it is important to pick the right one as some of the REITs have shown weakening fundamental. If you want to learn how to avoid choosing the wrong REITs, check out my next Singapore REITs training here.

Original post from https://mystocksinvesting.com
Check out coming seminars at https://mystocksinvesting.com/events