Risk should be THE key focus, not returns

  • Post author:

Attended a Business Conference yesterday. I summarize the key points for the investment outlook presented by Sani Hamid (Director, Wealth Management (Economy and Market Strategy) of Financial Alliance Pte Ltd).

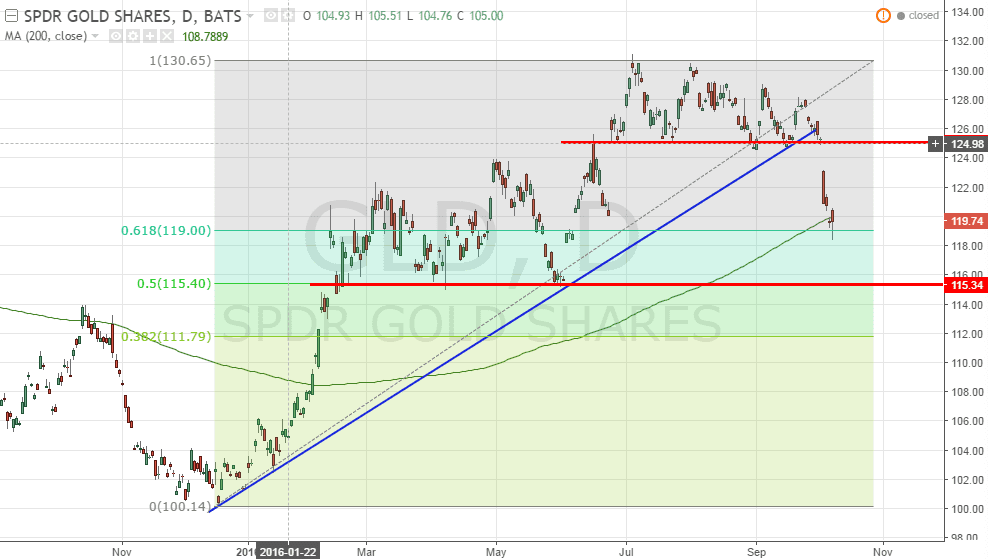
  • Gold’s tumble is not a concern. Focus remains on gold as insurance, not a commodity nor currency.
  • Gold is the ultimate ‘anti-bubble’ amid falling bond yields.
  • There are bigger concerns:
    • Increasingly a very worrisome “dysfunctional” environment:
      – Dysfunctional Monetary Policy
      – Dysfunctional Economies
      – Dysfunctional Fiscal Policy
      – Dysfunctional Markets
  • Not a normal environment. Risk should be THE key focus, not returns.
  • Dysfunctional Economies
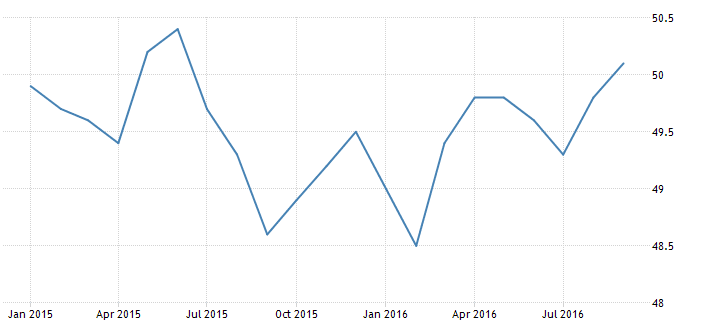
    • Despite low interest rates and abundant liquidity, economies remain mired in slow & low growth.
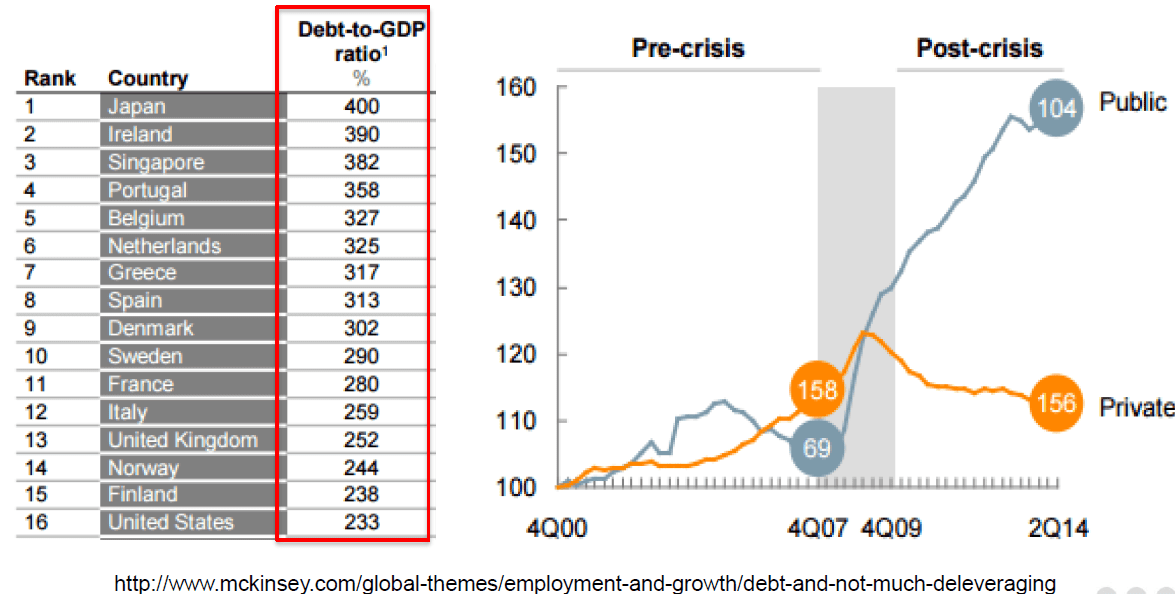
    • Current debt levels now sit at a record 225 percent of world gross domestic product, the IMF said in its semi-annual Fiscal Monitor.
    • Financial crises tend to be associated with excessive private debt in both advanced and emerging economies.
    • If companies postpone paying off debt,they could become “very sensitive to shocks, increasing the risk of an abrupt deleveraging process.
  • Dysfunctional Fiscal Policy
  • debt-gdpfiscal-policyDysfunctional Markets
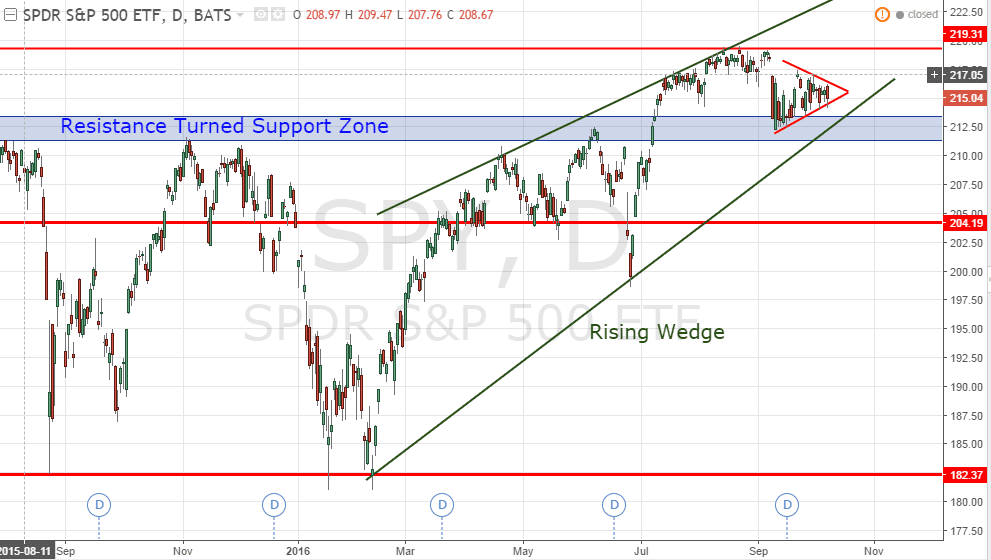
    • Equity markets continue to hold up despite weak profitability and revenue growth.
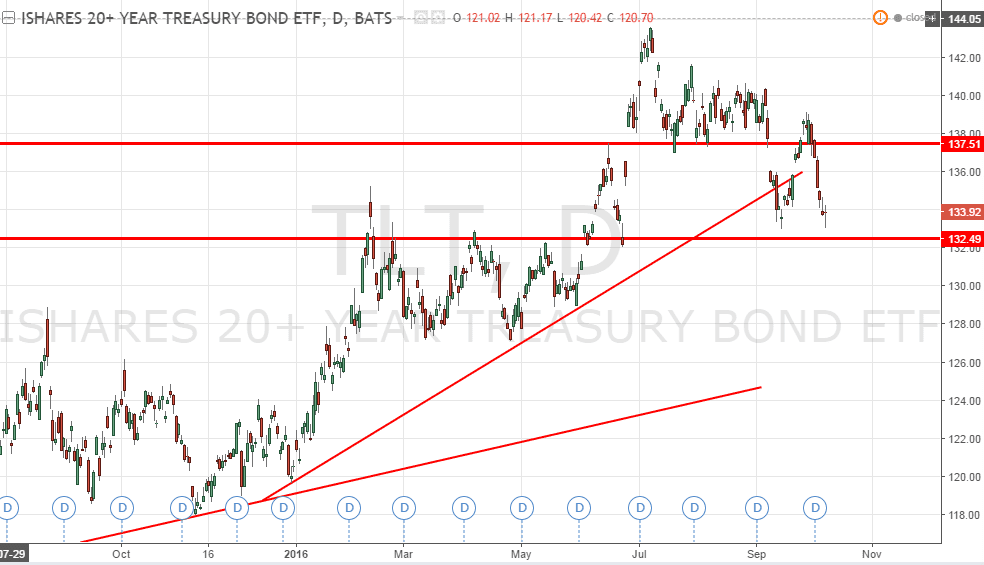
    • While bond markets burst at their seems despite being a crowded trade.
  • Investment Strategy:
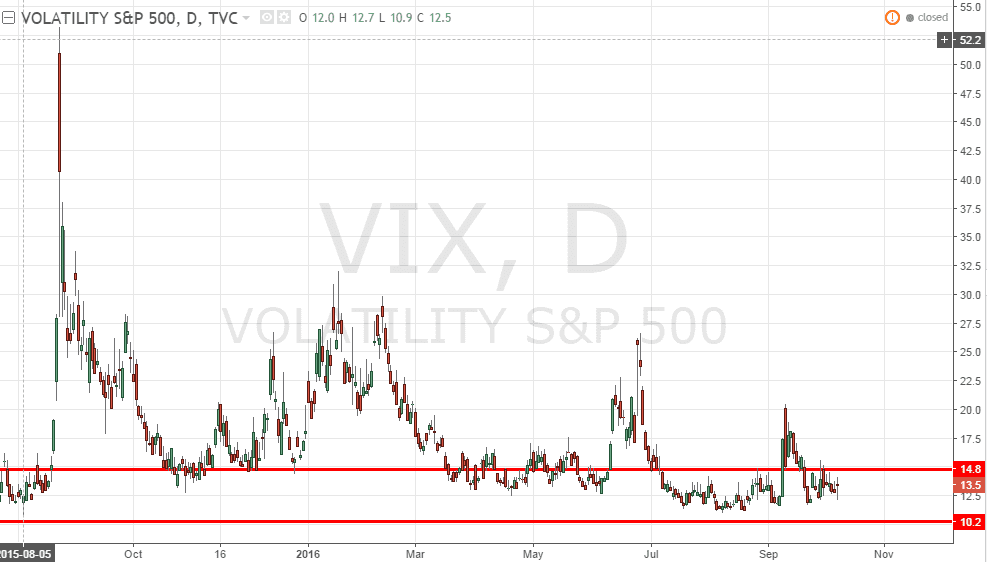
    • Not about timing the market but rather smoothing volatility
      • Our defensive strategy should not be confused with timing the market. Done to lower the market volatility.
      • Because clients are only human –inability to take sharp swings.

My key take away for current market condition:

  • Defensive
  • Manage Risk by portfolio diversification
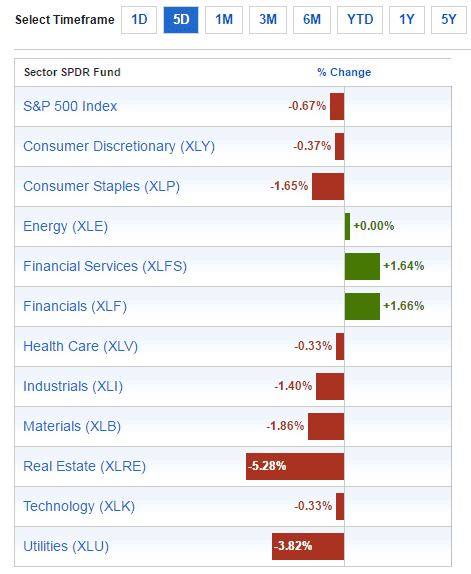
  • Focus on out performers
  • Portfolio re-balancing to manage the volatility

Join the coming workshop on “How to construct your retirement investment portfolio without losing sleep?”

See other event here. https://mystocksinvesting.com/events/


Continue ReadingRisk should be THE key focus, not returns

Weekly Inter Market Analysis Oct 9-2016

  • Post author:

See previous week Weekly Inter Market Analysis.

Original post from https://mystocksinvesting.com

SPY (SPDR S&P500 ETF)

SPY is currently forming a symmetrical triangle in a big Rising Wedge pattern. Symmetrical Triangle is a consolidation pattern until breakout. Keep an eye on on key supports:

  • Resistance turned support zone: 211-213
  • Rising Wedge immediate support: about 210
  • Previous Head and Shoulders neckline support: about 204.
  • Rising Wedge next support: about 200

spy-oct9-2016


VIX

VIX still stays below 15 – a complacent zone.

vix-oct9-2016


Sector Performance (SPDR Sector ETF)

  • Best Sectors: Financials (XLF) +1.66%
  • Worst Sector: Real Estate (XLRE) – 5.28%

sector-oct9-2016


SUDX (S&P US Dollar Futures Index)

SUDX broke out from the Symmetrical Triangle but immediately rejected at the support turned resistance at about 129.04 with a shooting star. Still need to wait for the confirmation of the breakout. Next FOMC statement on Nov 1/2.

sudx-oct9-2016


FXE (Currency Shares Euro ETF)

FXE is still trading sideway and range bound. Have to wait till next FOMC statement on Nov 1/2 before we can see the next big move.

fxe-oct9-2016


XLE (SPDR Energy Sector ETF)

Uptrend channel redrawn. XLE moves above 69.31. Critical support at 64.74 which has been tested for 5 times.

xle-oct9-2016


USO (United States Oil Fund)

USO broke out from Symmetrical Triangle but immediately rejected at the strong resistance with a Hanging Man with confirmation. Expect bearish reversal in the coming week.

uso-oct9-2016


TLT (iShares 20+ Years Treasury Bond ETF)

TLT broke 137.51 support and currently just resting on the next support at 132.5 with a Doji, indicates a pause in the recent down trend. Very interesting to see the sell down in TLT when SPY is moving side way.

tlt-oct9-2016


GLD (SPDR Gold Shares)

  • GLD broke down from the support with a gap down. GLD is currently testing a 200D SMA support. Can this 200D SMA support hold? Take note that 200D SMA is still trending up.
  • Fibonacci Retracement level redrawn for GLD. Currently GLD is also sitting on the 61.8% Fibonacci Retracement Support.
  • Expect GLD to rebound from level.

gld-oct9-2016


Next Week Economic Calendar

Key events:

  • FOMC Meeting Minutes on Oct 13 (Thursday)
  • Crude Oil Inventory on Oct 14 (Friday)
  • Janet Yellen speaks on Oct 15 (Saturday)

economic-calendar-oct9-oct15-2016

Continue ReadingWeekly Inter Market Analysis Oct 9-2016

Singapore REIT Fundamental Analysis Comparison Table – 9 October 2016

  • Post author:

FTSE ST Real Estate Investment Trusts (FTSE ST REIT Index) decreases from 768.70 to 764.77 (-0.51%) compare to last post on Singapore REIT Fundamental Comparison Table on Sept 12, 2016. The index is rejected at the declining trend line resistance and currently may be forming a right shoulders of a complicated Head and shoulders reversal pattern (i.e. 2 left shoulders).  Base on chart pattern, upside is limited although the index is still in bullish territory. SGX S-REIT (REIT.SI) Index increases from 1183.53 to 1176.60 (-0.59%).

ftse-st-reit-index-5y-oct9-2016ftse-st-reit-index-6m-oct9-2016


  • Price/NAV decreases from  1.017  to 1.012 (Singapore Overall REIT sector is slightly over value now)
  • Distribution Yield increases from 6.83% to 6.87% (take note that this is lagging number). Less than half of Singapore REITs (17 out of 39) have Distribution Yield > 7%. High yield REITs mainly from Hospitality Trust and small cap Industrial REIT. Selection of Singapore REITs have become much more important now because not all the high yield REITs has strong fundamental.
  • Gearing Ratio remains at 34.44%.  20 out of 39 have Gearing Ratio more than 35%.
  • Most overvalue is Ascendas iTrust (Price/NAV = 1.669), followed by Parkway Life (Price/NAV = 1.537) and Keppel DC REIT (Price/NAV = 1.392)
  • Most undervalue (base on NAV) is Far East HTrust (Price/NAV = 0.651), followed by Sabana REIT (Price/NAV = 0.656) and Fortune REIT (Price/NAV = 0.753).
  • Highest Distribution Yield is Sabana REIT (9.43%), followed by Cache Logistic Trust (9.09%) and Viva Industrial Trust (9.02%)
  • Highest Gearing Ratio is Croesus Retail Trust (45.3%), iREIT Global (41.8%) and Sabana REIT (41.2%)

singapore-reit-fundamental-analysis-and-comparison-table-9-oct-2016


Disclaimer: The above table is best used for “screening and shortlisting only”. It is NOT for investing (Buy / Sell) decision. To learn how to use the table and make investing decision, Sign up next REIT Investing Seminar here to learn how to choose a fundamentally strong REIT for long term investing for passive income generation.

  • Singapore Interest Rate remains at 0.38%.

singapore-interest-rate-oct9-2016sibor-oct9-2016

  • 1 month remains at 0.62233%
  • 3 month increases from 0.87192% to 0.87242%
  • 6 month decreases from 1.15071% to 1.14421%
  • 12 month remains at 1.31183%

singapore-manufacturing-pmi-oct9-2016


The Singapore Manufacturing PMI increased to 50.1 in September of 2016 from 49.8 in the previous month. The reading pointed to the expansion in the factory activity for the first time in 15 months, led by higher new orders, new exports, and output. Also, the electronics sector rose to 50.3 from 50.2 in August. Manufacturing PMI in Singapore averaged 50.03 from 2012 until 2016, reaching an all time high of 51.90 in October of 2014 and a record low of 48.30 in October of 2012. Manufacturing PMI in Singapore is reported by the Singapore Institute of Purchasing & Materials Management, SIPMM.


Singapore REITs in general is slightly over value now. Distribution yield for some Singapore REITs with bigger market capitalization is not very attractive. However, there are still opportunities in Singapore REITs with smaller market capitalization. Opportunities present in Hospitality sector as the valuation and yield is attractive but future DPU growth does not have good visibility.

Technically Singapore REITs sector is in bullish territory and on uptrend but facing immediate declining trend line resistance. Unlikely to see further upside in Singapore REIT sector due to the imminent potential interest hike end of the year after US Presidential Election.

Finally there is a REIT ETF launched in Singapore – PHILLIP SGX APAC DIVIDEND LEADERS REIT ETF. Check out Prospectus and Product Highlight Sheet here.

Original post from https://mystocksinvesting.com

Check out coming seminars at https://mystocksinvesting.com/events


Continue ReadingSingapore REIT Fundamental Analysis Comparison Table – 9 October 2016