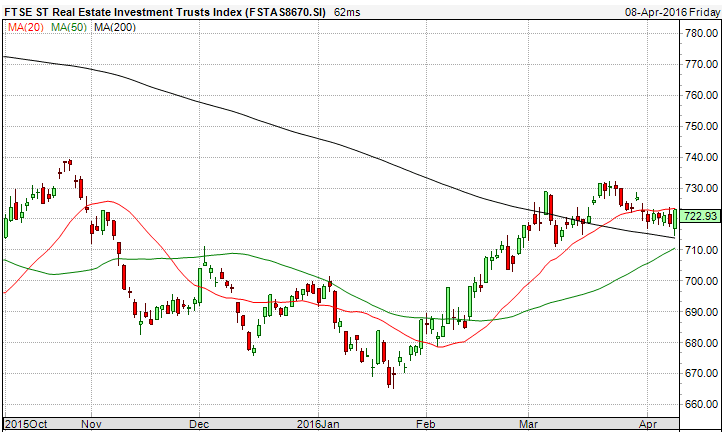
FTSE ST Real Estate Investment Trusts (FTSE ST REIT Index) decreases from 724.47 to 722.93 (-0.21%) compare to last post on Singapore REIT Fundamental Comparison Table on Mar 2, 2016. The index has broken above 200D SMA resistance at about 722 and is currently trading above the 200D SMA and 50D SMA is going to cross above 200D SMA. However, it is important to take note that the 200D SMA slope is still pointing down. The different direction of the 20D SMA (sideway), 50D SMA (up) and 200D SMA (down) indicates potential sideway consolidation of the Singapore REIT Index. SGX S-REIT (REIT.SI) Index at 1106.20.
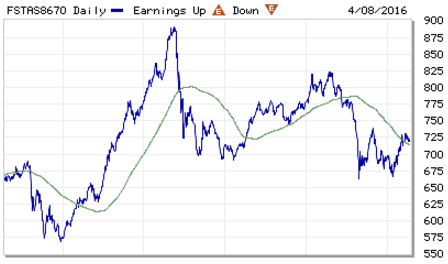
- Price/NAV increases from 0.93 to 0.95 (Singapore Overall REIT sector is under value now)
- Distribution Yield decreases from 7.40% to 7.33% (take note that this is lagging number). More than half of Singapore REITs (22 out of 37) have Distribution Yield > 7%. Current yield is attractive but dangerous to make investing decision purely base on the yield. Past performance does NOT equal to future performance.
- Gearing Ratio decreases from 35.15% to 35.04%. 23 out of 37 have Gearing Ratio more than 35%.
- Most overvalue is Parkway Life (Price/NAV = 1.46), followed by Ascendas iTrust (Price/NAV = 1.40).
- Most undervalue (base on NAV) is Fortune REIT (Price/NAV = 0.65), followed by Far East HTrust (Price/NAV = 0.68) and OUE Commercial REIT (Price/NAV = 0.68).
- Higher Distribution Yield is Lippo Malls Trust (9.97%) followed by Cache Logistic Trust (9.7%)
- Highest Gearing Ratio is Croesus Retail Trust (46.3%) followed by iREIT Global (42.6%)
- Note: Saizen REIT is removed from the table.
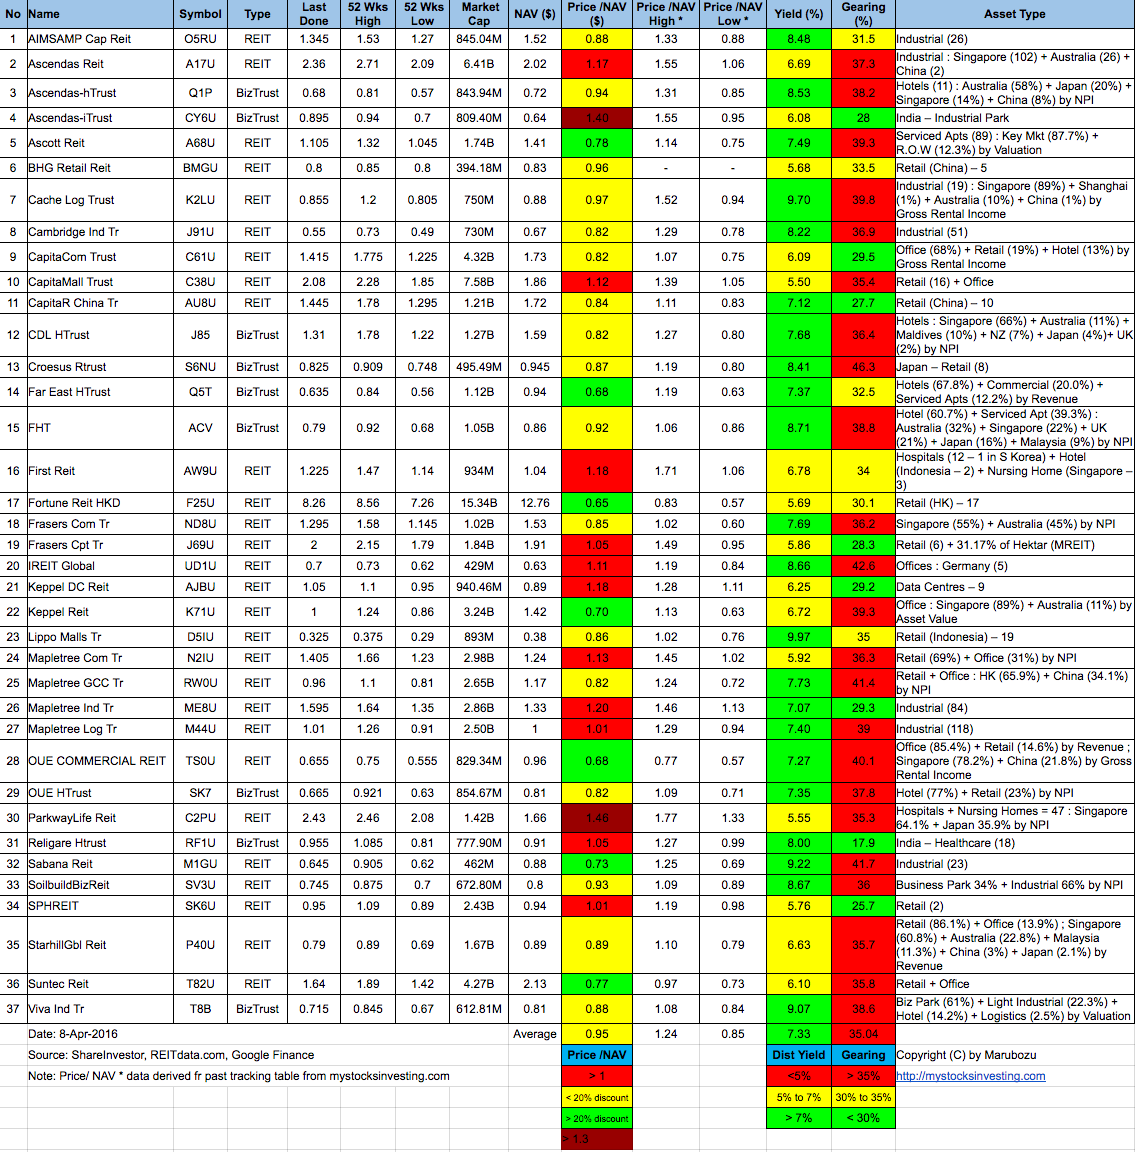
Disclaimer: The above table is best used for “screening and shortlisting only”. It is NOT for investing (Buy / Sell) decision. To learn how to use the table and make investing decision, Sign up next REIT Investing Seminar here to learn how to choose a fundamentally strong REIT for long term investing for passive income generation.
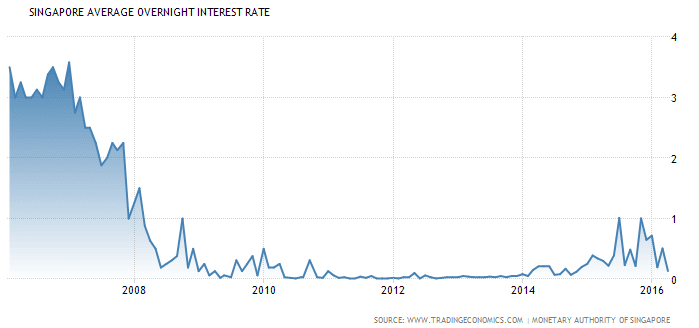
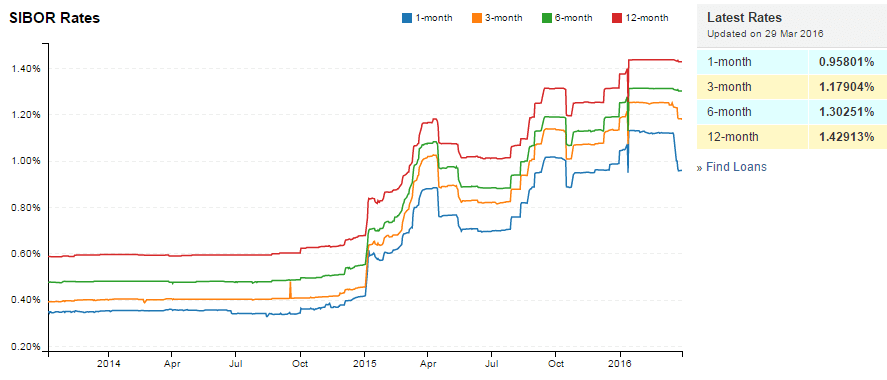
- Singapore Interest Rate decreases from 0.19% to 0.13%
- 1 month decreases from 1.11950% to 0.95801%
- 3 month decreases from 1.25200% to 1.17904%
- 6 month decreases from 1.31300% to 1.30251%
- 12 month decreases from 1.43800% to 1.42913%
Technically Singapore REITs sector is trading in consolidation and may start an uptrend. Combined with the attractive valuation and distribution yield, some Singapore REIT sector is worth to be considered for Investing for Passive Income provided there is no external shock and surprise interest rate hike announcement by Janet Yellen. Start picking up the fundamental strong REIT as these REITs provide faster capital appreciation when the uptrend starts in addition to the quarterly / half yearly distribution payout. Find out Which Singapore REIT to Buy and When is the Right Time to Buy in this coming Singapore REITs Investing class.