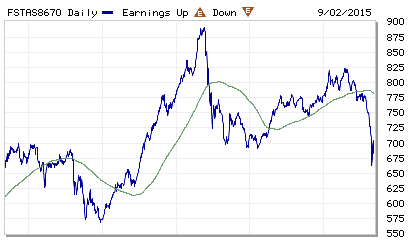
Singapore REIT Bubble Charts Sept 2015
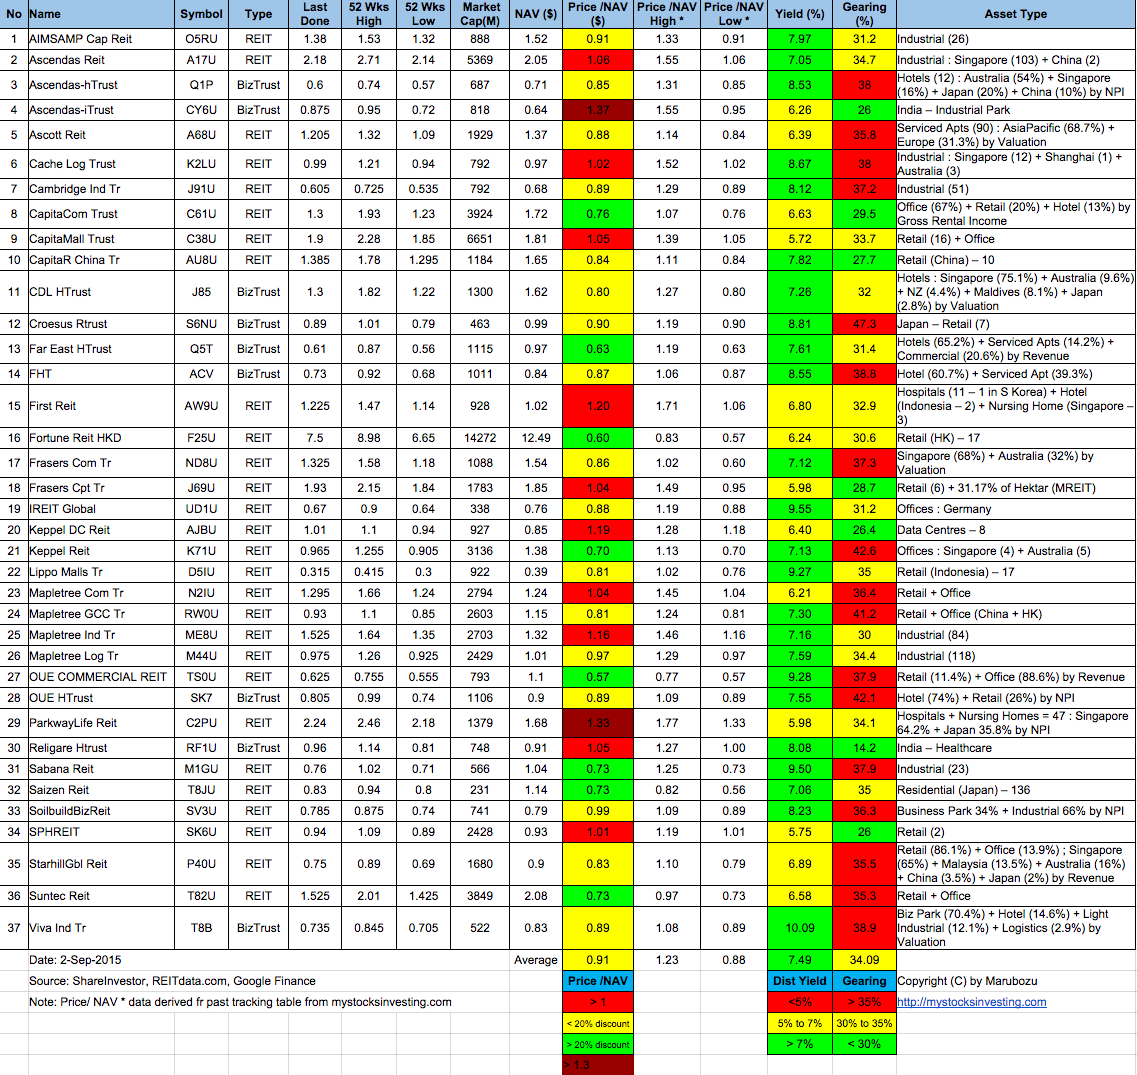
Bubble chart derived from Sept 2 Singapore REITs Fundamental Comparison Table.
These Bubble Charts are used to show the “relative” position compare to other Singapore REITs.
Two visual bubble charts to pick and avoid:
- Undervalue Singapore REITs with High Distribution Yield (Value Pick)
- Overvalue Singapore REITs with High Gearing Ratio (Risk Avoidance)
The Singapore REIT Bubble charts are best used to visually Short List Singapore REIT only.
Disclaimer:
- The bubble charts are NOT to be used as Investing decision.
- Besides looking at the Price/NAV, Distribution Yield, Gearing Ratio, Investors still have to conduct Risk Assessments, Qualitative Analysis and Sector / Trend Analysis on the REITs.
- The Author does not guarantee the accuracy of the data presented and not responsible for any readers profit & loss should an investment decision being made using the data in this blog https://mystocksinvesting.com


See last Singapore REIT Bubble Charts here to see the relative movement.
Current distribution yield for Singapore REITs are very attractive but there are downside risks base on fundamental and technical analysis. Investors are strongly encouraged to acquire a proper financial education on how to analyse Singapore REITs to make a safe investing decision, instead of just asking around for the stock tips.