The Nuts And Bolts Of MSR And TDSR

  • Post author:

Guest Post: By iCompareLoan Editorial Team


TDSR, or Total Debt Servicing Ratio, is a relatively new regulation in Singapore’s real estate market. Introduced only on 28 June 2013 after seven rounds of property cooling measures had been implemented since 14 September 2009, nonetheless the Government did not regard it as yet another series of cooling measure. Rather it was hailed as long-term measure to ensure that financial institutions practise prudence when disbursing property loans.

In contrast, MSR, or Mortgage Servicing Ratio, was mandated for MAS-regulated financial institutions (FIs) for the first time, during the seventh round of cooling measures in January 2013. Before only mortgages by HDB have to follow a MSR.

Given that TDSR and MSR are likely here to stay, let us set the record straight between the two.


Table 1: Comparing MSR And TDSR

MSR

TDSR

The monthly repayment of a mortgage do not exceed 30% of the borrower’s gross income

All monthly debt obligations, inclusive of the mortgage repayment, do not exceed 60% of the borrower’s gross monthly income

Applies to all mortgages, whether by FIs or HDB, granted for the purchase of a HDB flat or an EC

Applies to all property loans, whether residential properties or otherwise, granted by FIs

Hence HDB concessionary loans are exempted from it

When computing the MSR, the FI has to use a specified medium-term rate (3.5%), or the existing market rate, whichever is higher.

For the HDB concessionary loan, the rate to be used is the prevailing rate of the loan which has remained at 2.60% p.a. since July 1999.

When computing the TDSR, the FI has to use a specified medium-term rate, or the existing market rate, whichever is higher.

The specified rate:

  • 3.5% for housing loans

  • 4.5% for non-residential property loans

For refinancing,

the MSR will not apply to loans for HDB flats and ECs that are

  • owner-occupied, AND
  • were purchased before their respective MSR implementation dates

For refinancing,

the TDSR will not apply if

  • the residential property is owner-occupied, AND

  • the Option to Purchase (OTP) of the residential property was granted before 29 June 2013

Source: HDB, MAS, MND


For advice on a new home loan.

For refinancing advice.

Continue ReadingThe Nuts And Bolts Of MSR And TDSR

Singapore REIT Fundamental Analysis Comparison Table – 4 Jan 2015

  • Post author:

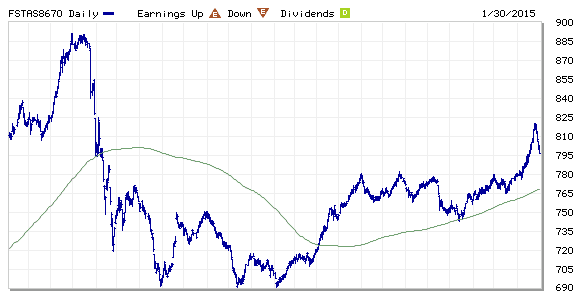
FTSE ST Real Estate Investment Trusts (FTSE ST REIT) Index changes from 774.40 to 781.16 compare to last post on Singapore REIT Fundamental Comparison Table on Dec 14, 2014. The index is currently testing the 52 weeks high resistance.  Long term trend for Singapore REIT is bullish base on the chart pattern of this ST REIT index as the 200D SMA is trending up. The index is currently range bound in consolidation mode and moving sideway until there is a breakout.

FTSE ST REIT Index Jan4-2015

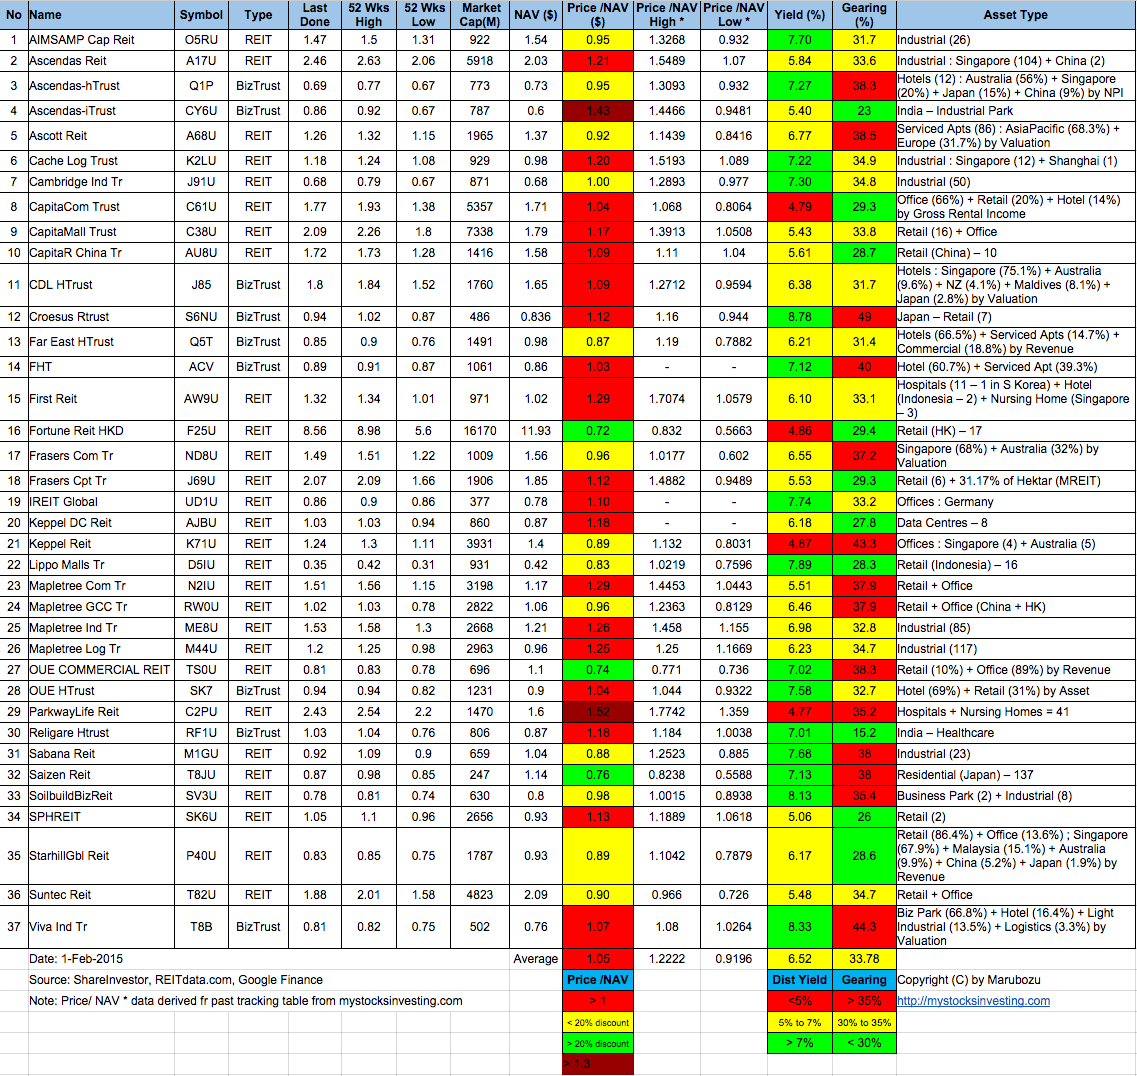
  • Added Keppel DC REIT and updated Price/NAV high and low for some REITs.
  • Price/NAV no change at 1.04 (slightly over value now)
  • Distribution Yield decreases slightly from 6.59% to 6.57% (take note that this is lagging number, past DPU does not represent future DPU). Note: I did not color code the yield number because yield is relative to individual risk appetite. High Yield does NOT mean it is a good REIT. Low Yield does NOT mean it is a bad REIT. We have to analyse the Fundamental and do Risk Assessment of the REIT.
  • Gearing Ratio decreases slightly from 33.90% to 33.74%..

Singapore-REIT-Fundamental-Analysis-and-Comparison-Table-4-Jan-2015

Singapore Interest Rate Jan4-2015

SIBOR Dec 31-2014

Keep a close eye on Singapore Interest Rate and SIBOR which is increasing quietly.

There are 37 Real Estate Investment Trust in Singapore as shown in the above table. Most people just purely choose the REIT with HIGH DIVIDEND and invest blindly without knowing what are the RISKS. If you want to learn how to pick the right REIT and invest to generate passive income safely, check out the very pragmatic and educational public seminar here “Investing in Singapore REIT“.

Grab an insight of the REIT class here 3 Tips To Increasing Returns On REITs Investments


Continue ReadingSingapore REIT Fundamental Analysis Comparison Table – 4 Jan 2015

Global Stock Market Indices PE & PB Ratio At a Glance (1 Jan 2015)

  • Post author:

Happy New Year 2015!

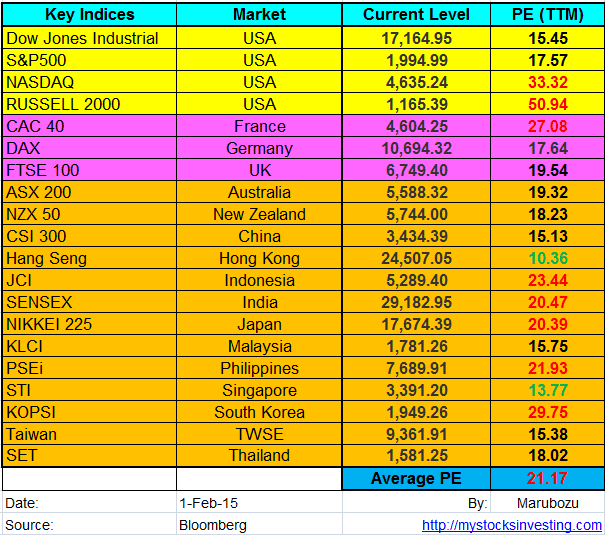
The following market data can give an inside view on what could be the stock market outlook in 2015.

Market Indices PE & PB Ratio for Major Stock Exchange globally

  • US: Dow Jones Industrial, S&P500, NASDAQ, Russell 2000
  • Europe: FTSE100, CAC40, DAX
  • Asia: KLCI, STI, HangSeng, ASX200, CSI 300, JCI, SET, KOPSI, NIKKEI 225, SENSEX, TWSE, NZX50, PSEi

Global Stock Market PE PB Ratio Summary Jan 1-2015

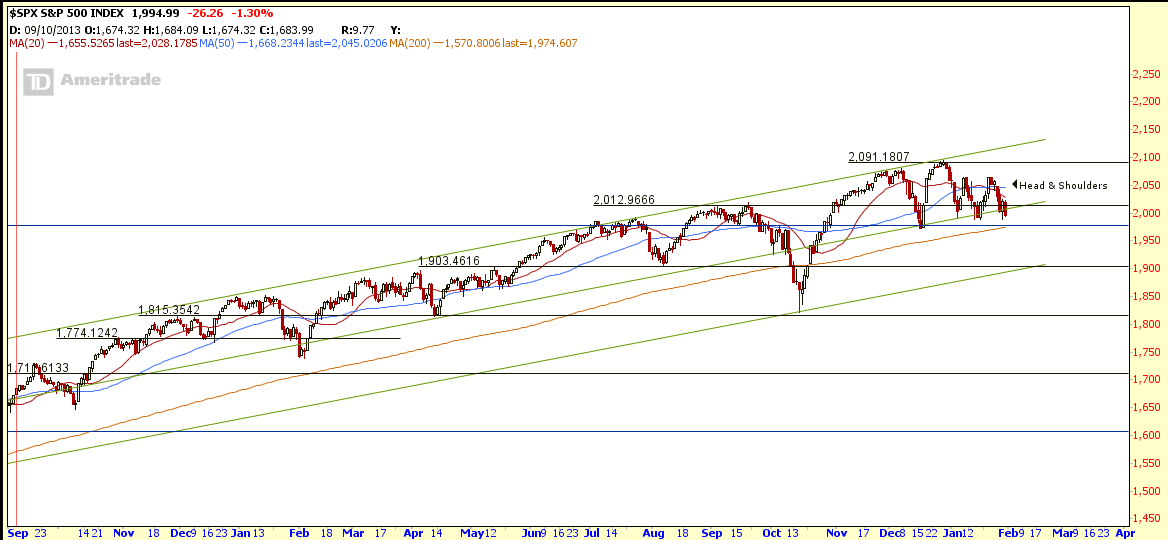
Dow Jones Industrial, S&P500 and NASDAQ are still on uptrend but have shown the reversal candlestick pattern at the last trading day of 2014. Average PE ratio decreases from 23.17 to 21.30 whereas PB Ratio decreases from 2.27 to 2.22. Most of the stock market now are overvalue now. Technically $INDU, $SPX, $COMP are all on clear up trend and we are entering a seasonally most bullish six months from Nov to April base on past statistics. However, it is important to be cautious that stock market may go through the sharp correction after the QE ends. At the moment, we may still in the middle of Santa Claus Rally.

See Dec 2014 Global Stock Market PE Ratio here.

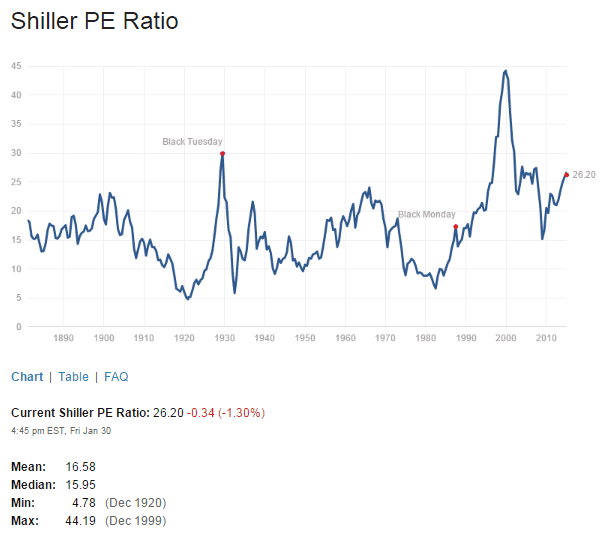
Shiller PE Ratio Jan1-2015S&P500 PB Ratio Jan1-2015S&P500 Dividend Yield Jan1-2015

  • PE  = Price Per Earning
  • PB = Price To Book Value

Dow Jones Industrial, S&P500, NASDAQ, Russel 2000 Charts

  • INDU, SPX, COMP are still on uptrend but show short term reversal pattern.
  • RUT is trading sideway but hitting the resistance.

DJI Jan1-2015 SPX Jan1-2015NASDAQ Jan1-2015 Russell 2000 RUT Jan1-2015

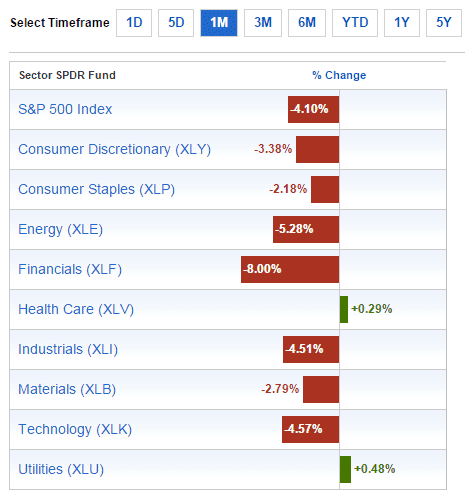
Past 1 Month Sector Performance

Sector Performance Jan1-2015


Treasury Yield

US 5 Year Treasuy Yield Jan1-2015 US 10 Year Treasuy Yield Jan1-2015 US 30 Year Treasuy Yield Jan1-2015


  • If you want to understand how to conduct the above stock market analysis, how and where to find the free (and right) data from internet, how to analyse the data, how to combine all the analysis and form an own opinion to predict the stock market next moment? Check out the Fundamental Analysis Class here.
Continue ReadingGlobal Stock Market Indices PE & PB Ratio At a Glance (1 Jan 2015)