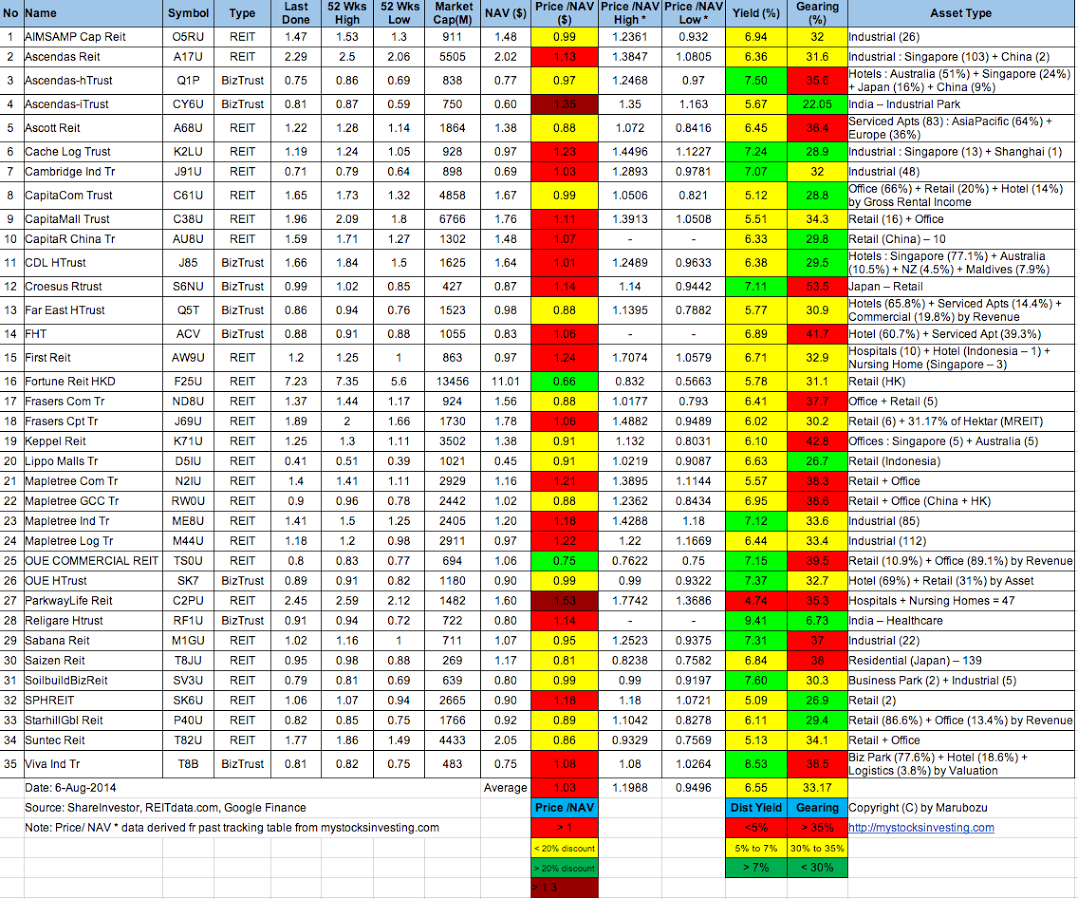
Singapore REIT Fundamental Analysis Comparison Table – 7 Aug 2014
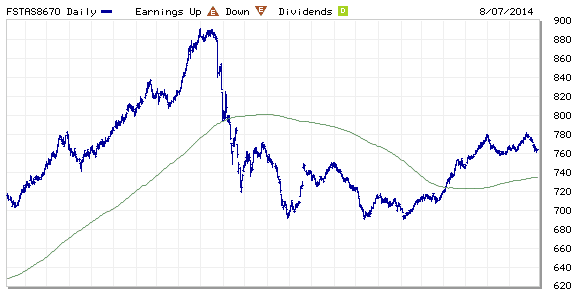
FTSE ST Real Estate Investment Trusts (FTSE ST REIT) Index changes from 766.91 to 764.31 compare to last post on Singapore REIT Fundamental Comparison Table on July 10, 2014. The index is trading above 200D SMA but consolidating within a range between 760 and 780, a Rectangle consolidation pattern. Watch closely these two support and resistances level to see whether there is a change in trend. Pay special attention if the 760 support is broken.
- Price/NAV decreases slightly from 1.0386 to 1.03.
- Dividend Yield increases from 6.42% to 6.55%.
- Gearing Ratio increases from 32.94% to 33.17%
- Frasers Hospitality Trust (FHT) traded on the Singapore Stock Exchange on July 14, 2014.
- Added CapitalR China Trust.
- I receive many questions on REITs and I can’t answer all of them in the emails. You may get questions answered in the the next workshop on “How to pick Singapore REIT for Dividend Investing” . I will also share how to analyse the overall trend for Singapore REITs using simple Trend Analysis.