Global Stock Market Indices PE Ratio At a Glance (9 July 2014)

  • Post author:

Market Indices PE Ratio for Major Stock Exchange globally.

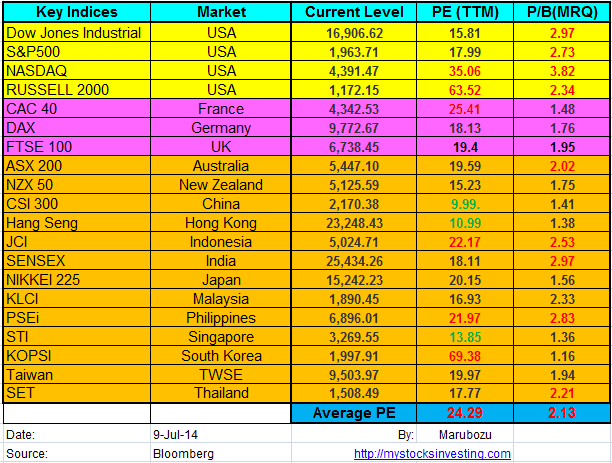
  • US: Dow Jones Industrial, S&P500, NASDAQ, Russell 2000
  • Europe: FTSE100, CAC40, DAX
  • Asia: KLCI, STI, HangSeng, ASX200, CSI 300, JCI, SET, KOPSI, NIKKEI 225, SENSEX, TWSE, NZX50, PSEi

Average PE ratio increases from 23.18 to 24.29 where Dow Jones Industrial, S&P500 and NASDAQ broke new high. P/B Ratio increase from 2.12 to 2.13..

Stock Market Key Indices PE Ratio July9-2014

June 2014 Month Global PE Ratio.

See the compilation of Monthly Global Stock Market here.

Shiller PE Ratio July9-2014S&P500 PB Ratio July9-2014


  • PE  = Price Per Earning
  • PB = Price To Book Value
  • Want to Learn More about how to value the stock market using PE Ratio or PB Ratio? Check out the Fundamental Analysis Class here.


.


.


Continue ReadingGlobal Stock Market Indices PE Ratio At a Glance (9 July 2014)

Noble Group: On Confirmed Up Trend

  • Post author:

Noble Group retraced and rebounded from the up trend support trend line.  Next immediate resistance is $1.48 followed by the price target of $1.60 – $1.63. (150% and 161.8% FR). Watch out for the Earning Announcement on 8/7/2014.

Original post by Marubozu from My Stocks Investing Journey.

2014July4-Noble Group

Current P/E Ratio (ttm) 17.7727
Estimated P/E(12/2014) 14.0551
Relative P/E vs. FSSTI 1.2849
Earnings Per Share (USD) (ttm) 0.0632
Est. EPS (USD) (12/2014) 0.0800
Est. PEG Ratio 0.6823
Market Cap (M SGD) 9,399.37
Shares Outstanding (M) 6,713.83
30 Day Average Volume 22,935,700
Price/Book (mrq) 1.5169
Price/Sale (ttm) 0.0755
Dividend Indicated Gross Yield 0.81%
Cash Dividend (USD) 0.0091
Dividend Ex-Date 05/12/2014
5 Year Dividend Growth -22.92%
Next Earnings Announcement 08/07/2014
Continue ReadingNoble Group: On Confirmed Up Trend

Tat Hong Holdings: on Up Trend

  • Post author:

Tat Hong has bottomed up and reversed to the confirmed uptrend. Tat Hong is forming a “Higher High, Higher Low” up trend pattern and trading above all the 3 Moving Averages. The moving averages between $0.84 to $0.87 should provide a good support for Tat Hong to continue the up trend.

Original post by Marubozu from My Stocks Investing Journey.

Tat Hong July2-2014

Current P/E Ratio (ttm) 17.5728
Estimated P/E(03/2015) 13.9231
Relative P/E vs. FSSTI 1.2701
Earnings Per Share (SGD) (ttm) 0.0515
Est. EPS (SGD) (03/2015) 0.0650
Est. PEG Ratio 0.7822
Market Cap (M SGD) 569.90
Shares Outstanding (M) 629.73
30 Day Average Volume 1,090,600
Price/Book (mrq) 0.8538
Price/Sale (ttm) 0.8494
Dividend Indicated Gross Yield 2.21%
Cash Dividend (SGD) 0.0100
Dividend Ex-Date 08/15/2014
5 Year Dividend Growth -13.67%
Next Earnings Announcement 08/13/2014
Continue ReadingTat Hong Holdings: on Up Trend