Starhill Global REIT: Under Watchlist
Fundamental Analysis of Starhill Global REIT:
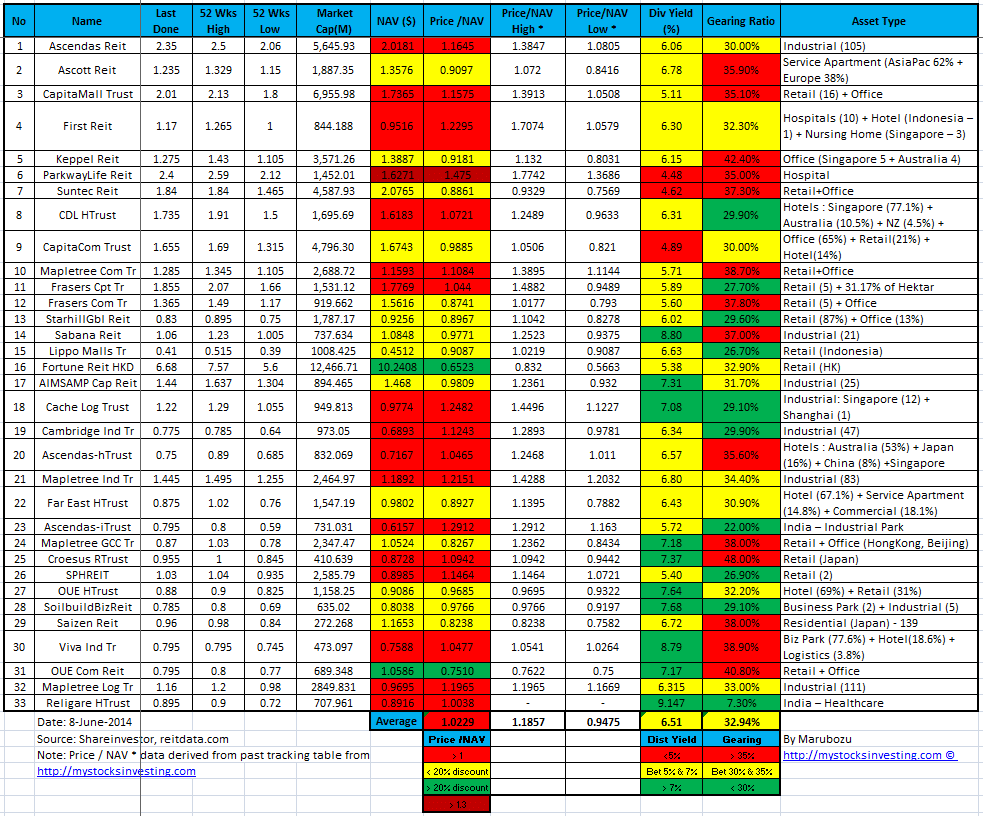
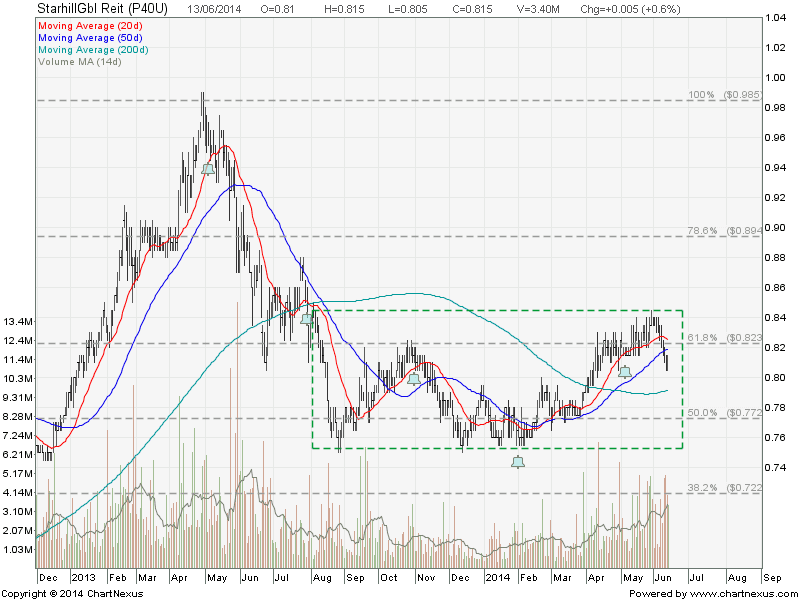
- Last Price = $0.81
- NAV = $0.92
- Price / NAV = 0.8804
- Price / NAV (52 Weeks High) = 1.1042
- Price / NAV (52 Weeks Low) = 0.8278
- Distribution Yield = 6.21%
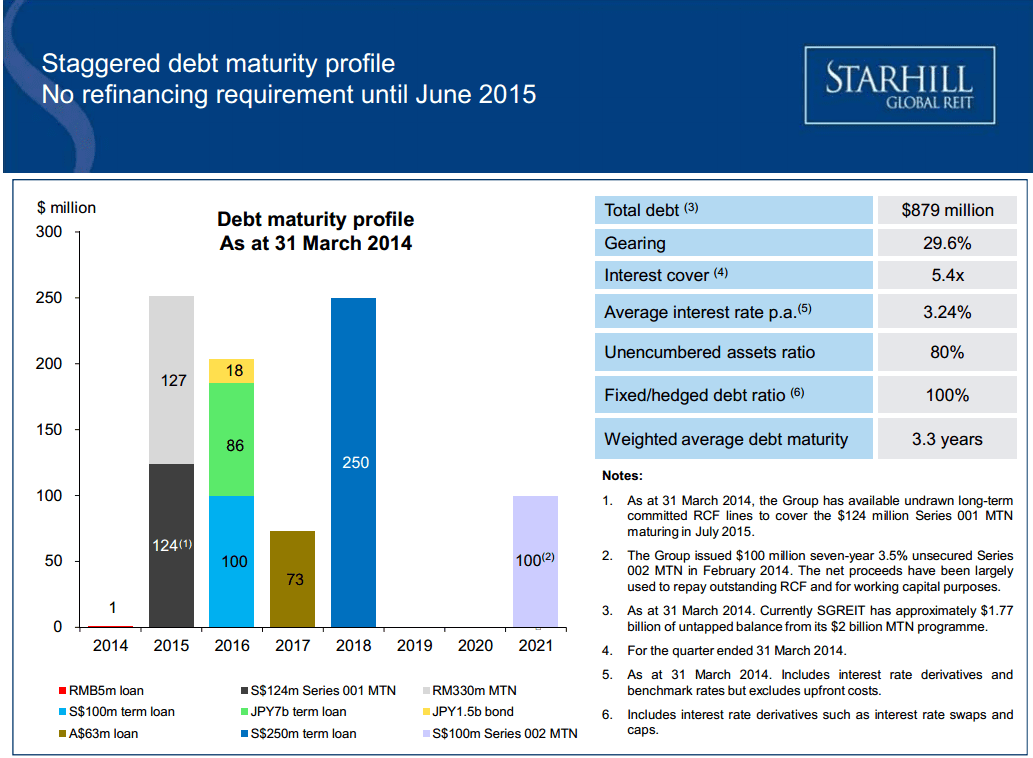
- Gearing Ratio = 29.6%
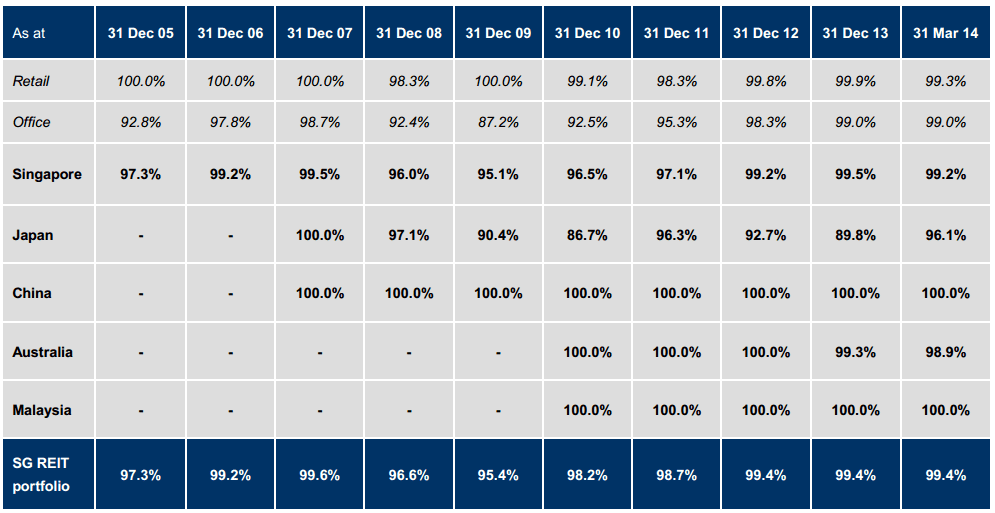
- Occupancy Rate = 99.4%
- WADM = 3.3 Years
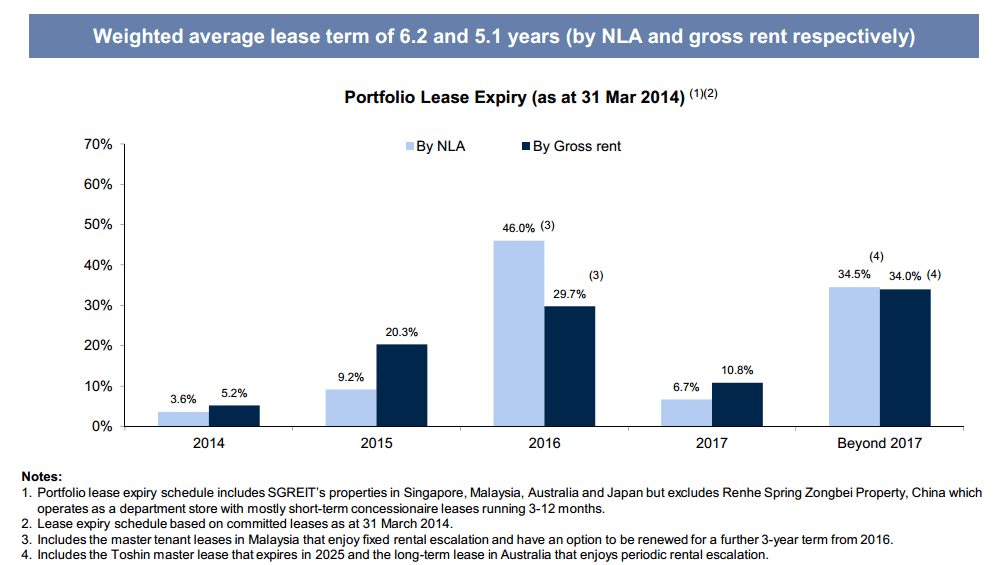
- WALE = 5.1 Years
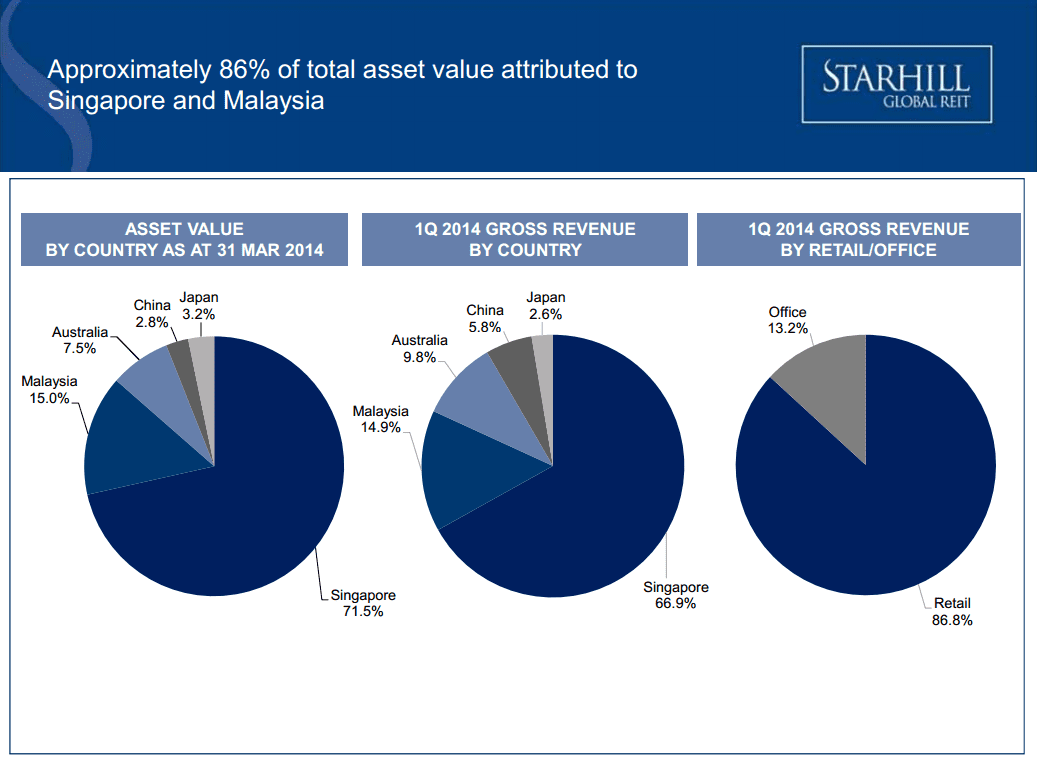
- Base on Starhill Global REIT April 29 Presentation.

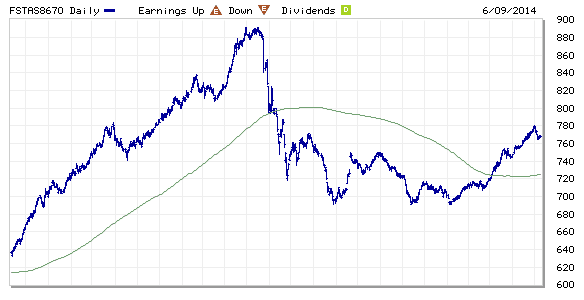
Technically Starhill Global REIT is trading in a Rectangle and range bound between $0.755 and $0.845.
Compare with other Singapore REITs, Starhill Global is traded at a 12% discount to NAV with Distribution yield at 6.21%. Fundamentally this REIT is attractive in terms of Price/NAV, Distribution Yield and Gearing Ratio. However, technically the chart is moving sideway and looks like this REIT is going through a retracement currently. A much more attractive entry level is to wait for Starhill Global to retrace back to the Rectangle support at about $0.755. The yield at this price is about 6.5% with Price / NAV about 0.82 (18% discount to NAV). A little concern over the WADB as about 30% debt is going to mature in 2015 and Starhill Global REIT may need to refinance at a higher interest rate, thus impact the DPU.
I will be covering the above analysis method in my Singapore REIT Investing public workshop, I strongly suggest you to sign up and understand how to do a proper analysis (Fundamental Analysis, Risk Assessment, Technical Analysis) on the REIT before throwing the money into stock market by selecting the wrong REIT and investing in the wrong time.