Estate planning is not just about writing a Will. It’s a complete framework of decisions that ensures your assets are protected and your wishes are honored, especially during your most vulnerable times.
Far too often, we see avoidable and costly legal mistakes occur when critical elements like CPF nominations or the Lasting Power of Attorney (LPA) are neglected.
We are committed to helping you navigate these complex, but essential, steps to protect your wealth and your loved ones. Join us for our upcoming estate planning series, designed to give you clarity and direct action on these crucial topics.
Drop me a message for the invitation link! kennyloh@fapl.sg
Our expert-led talks on June 27th will cover:
✅ 1. 𝐂𝐏𝐅 𝐍𝐨𝐦𝐢𝐧𝐚𝐭𝐢𝐨𝐧: How to make direct, online nominations and avoid having your funds distributed by the Intestate Succession Act.
✅ 2. 𝐋𝐚𝐬𝐭𝐢𝐧𝐠 𝐏𝐨𝐰𝐞𝐫 𝐨𝐟 𝐀𝐭𝐭𝐨𝐫𝐧𝐞𝐲 (𝐋𝐏𝐀) 𝐚𝐧𝐝 𝐖𝐢𝐥𝐥𝐬: The distinction between protecting your decisions while you’re alive vs. distributing assets after.
✅ 3. 𝐓𝐫𝐮𝐬𝐭 𝐚𝐧𝐝 𝐀𝐬𝐬𝐞𝐭 𝐏𝐫𝐨𝐭𝐞𝐜𝐭𝐢𝐨𝐧: Understanding advanced mechanisms to legally shield your wealth for beneficiaries.
Legacy planning is the ultimate act of financial stewardship. Join us and gain the knowledge needed to build a secure future for your family.
Kenny Loh is a distinguished Wealth Advisory Director (RNF# LKK300389588 Representing Financial Alliance) with a specialization in holistic investment planning and estate management. He excels in assisting clients to grow their investment capital and establish passive income streams for retirement. Kenny also facilitates tax-efficient portfolio transfers to beneficiaries, ensuring tax-efficient capital appreciation through risk mitigation approaches and optimized wealth transfer through strategic asset structuring.
In addition to his advisory role, Kenny is an esteemed SGX Academy trainer specializing in S-REIT investing and regularly shares his insights on MoneyFM 89.3. He holds the titles of Certified Estate & Legacy Planning Consultant and CERTIFIED FINANCIAL PLANNER (CFP).
With over a decade of experience in holistic estate planning, Kenny employs a unique “3-in-1 Will, LPA, and Standby Trust” solution to address clients’ social considerations, legal obligations, emotional needs, and family harmony. He holds double master’s degrees in Business Administration and Electrical Engineering, and is an Associate Estate Planning Practitioner (AEPP), a designation jointly awarded by The Society of Will Writers & Estate Planning Practitioners (SWWEPP) of the United Kingdom and Estate Planning Practitioner Limited (EPPL), the accreditation body for Asia.
Arrange for a non-obligatory one-to-one free consultation here!
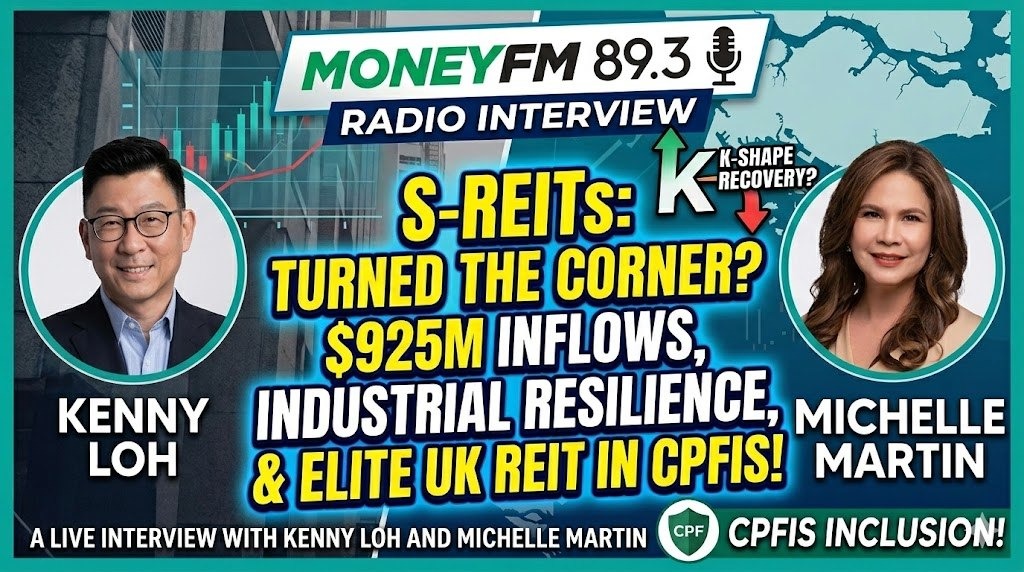
The Singapore Real Estate Investment Trust (S-REIT) market is experiencing a massive tug-of-war between micro-level operational strength and macro-level financial pressure. Whether you are looking to maximize your passive income or optimize your retirement funds, this comprehensive market briefing breaks down the three massive trends shaping the S-REIT landscape right now—and a monumental new regulatory update that changes the game for CPF investors.
1. The $925M Retail Capital Shift: A Strategic Hunt for Yield
Retail investors are aggressively voting with their wallets, pouring a staggering $925 million into S-REITs up to late May 2026. This massive reallocation of capital is being driven by a stark reality: low-risk local cash alternatives have completely lost their edge.
The Macro Disconnect: Cash vs. Property Yields• T-Bills & SSBs Flatten Out: The yield on the 6-month Singapore Treasury Bill (T-bill) has stabilized at a low 1.48%. Similarly, Singapore Savings Bonds (SSBs) offer a first-year return of just 1.46%.• Fixed Deposits Cool Off: Bank fixed deposit rates have largely hit a ceiling between 1.50% to 1.60% for standard 6-to-12-month tenors.• The S-REIT Advantage: In comparison, the average dividend yield for Singapore REITs stands at a highly attractive 5.9%, with several quality industrial and specialized counters pushing yields north of 7% to 9%.
With a spread of over 400 basis points between T-bills and average property yields, local investors are moving out of cash to protect their purchasing power against sticky inflation.
Key Moving Counters: Where is the Money Going?• UI Boustead REIT: Topped the entire sector for retail inflows relative to its market cap, bringing in $62.8 million as opportunistic buyers capitalized on its strong 92.2% occupancy and new logistics expansion in Japan.• Daiwa House Logistics Trust (DHLT) & Parkway Life REIT: Strongly accumulated as defensive anchors due to high structural income visibility, with locked-in master leases extending well past 2030.• CapitaLand India Trust (CLINT) & CapitaLand Ascendas REIT (CLAR): Highly favored for robust leasing momentum in tech-industrial parks and data center infrastructure.
Industrial real estate continues to be the star performer of the sector. Structural demand from e-commerce, localized logistics, and AI data infrastructure is allowing top-tier managers to extract high single-to-double-digit positive rental reversions.
Standout Execution in the Current Environment:• CapitaLand Ascendas REIT (CLAR): Successfully delivered a strong +10.6% rental reversion across its Singapore and US portfolios. Furthermore, management expertly insulated its balance sheet via a massive S$903.5 million equity fund raising, bringing aggregate leverage down to a very safe ~37.3%.• Mapletree Logistics Trust (MLT): Provided a textbook lesson in capital recycling. MLT divested 6 older, low-yielding properties at an average premium of 20% to valuation, immediately redeploying that liquidity into modern Grade-A logistics assets in high-growth corridors like Mumbai, India.• Alpha Integrated REIT: A masterclass in proactive asset management, sustaining an incredible streak of positive rental reversions for over 14 consecutive quarters by engaging tenants aggressively well ahead of lease expiries.
3. The Deal Boom: Cracking the “K-Shaped” Disconnect
Acquisition activity has picked up sharply, with S-REITs announcing over S$6.3 billion in deals in the first few months of the year alone—highlighted by CapitaLand Integrated Commercial Trust (CICT) acquiring Paragon for S$3.9 billion.
Why is Deal-Making Back?
The Federal Reserve’s pause on interest rates (stabilizing around 3.5% to 3.75%) has removed the paralyzing valuation uncertainty of the last two years. Managers can finally price debt and model equity fund management with confidence.
Have S-REITs Finally Turned the Corner?
Yes, structurally they have—but the recovery is strictly K-shaped. This split dynamic determines who wins and who falls behind:
▲ Upper Arm (The Winners): Large-cap, sponsor-backed blue chips (CapitaLand, Mapletree, Frasers). They feature strong balance sheets, powerful capital recycling options, and the ability to drive accretive DPU growth.▼ Lower Arm (The Laggards): Highly leveraged, small-to-mid-cap REITs with older assets. Squeezed by the ‘Refinancing Wall’ as fixed hedges expire, forcing them to absorb higher interest expenses that compress distributions.
The Price Disconnect: Many investors wonder why REIT stock prices remain lackluster when buildings are full. The answer is the Refinancing Wall. S-REITs are currently rolling over cheap, old fixed-rate debt (locked in at 1.5% years ago) into today’s higher 3.5% market baseline. Even when top-line rental revenue grows beautifully, the higher interest costs chew up those gains, keeping short-term distributions flat.
The Split Market: The upper arm of the K belongs to the mega-cap blue chips that can aggressively divest mature assets at a premium and buy modern assets. The lower arm of the K contains highly leveraged, smaller REITs with older properties that face a long, slow grind to refinance without diluting unitholders. Stock selection is everything.
4. Landmark Update: Elite UK REIT Joins CPFIS
Effective June 9, 2026, Elite UK REIT (SGX: MENU) announced that its Singapore Dollar (SGD) counter has been officially included under the Central Provident Fund Investment Scheme (CPFIS) for the Ordinary Account (OA).
Is this the first REIT under CPFIS?
No, major local blue chips are already eligible. However, Elite UK REIT is the first and only pure-play UK-focused REIT to achieve CPFIS status. Clearing the stringent liquidity, governance, and capital safety filters mandated by the CPF Board is a massive regulatory stamp of approval for a foreign-asset vehicle.
Why was it included?
The REIT offers a uniquely resilient, institutional-grade underlying business structure:• Sovereign-Backed Income: Over 99% of its gross rental income is derived directly from the UK Government (primarily the Department for Work and Pensions), functioning as mission-critical public social infrastructure.• High Cash Flow Visibility: Features virtually 100% rent collection, paid three months in advance, fully backed by AA-rated sovereign credit.
Why would CPF holders want to invest?
The standard CPF Ordinary Account offers a guaranteed but static 2.5% return. With major brokerages highlighting Elite UK REIT’s sustainable forward dividend yield of around 9%, it offers an incredible 6.5% yield pickup. It provides a direct, highly accessible gateway for local savers to diversify their retirement funds into UK real estate right on the SGX platform.
The Essential Risks to Consider
As with any high-yielding asset, higher returns come with clear trade-offs that CPF investors must carefully weigh:• Concentration & Lease Renewal Risk (2028 Horizon): The UK Government’s Department for Work and Pensions (DWP) contributes roughly 92% of the REIT’s gross rental income. A significant cluster of these leases comes up for renewal/regearing in 2028. Any physical consolidation by the UK government could impact future vacancy rates.• Foreign Exchange (FX) Translation Risk: While the REIT is naturally hedged operationally (generating rent and holding debt in British Pounds), a severely weakening Sterling against a strengthening Singapore Dollar will structurally shrink the actual SGD dividend payout received by local investors.• Capital Volatility: Moving your funds out of the CPF-OA means trading a principal-guaranteed, risk-free 2.5% return for secondary market equity price fluctuations. Position sizing under the 35% CPFIS stock limit remains critical.
Summary for Investors
The worst of the macroeconomic interest rate storm is officially behind us, and the reopening of the multi-billion-dollar acquisition gateway proves that confidence is returning. However, in a K-shaped recovery environment, the days of buying the entire sector and hoping for equal gains are over. Focus on quality sponsors, robust capital recycling track records, and clear distribution visibility to navigate the market successfully.
Disclaimer: This article is for educational and informational purposes only and does not constitute financial advice. Investors should conduct their own due diligence or consult a licensed financial representative before deploying cash or CPFIS funds into market securities.
Kenny Loh is a distinguished Wealth Advisory Director (RNF# LKK300389588 Representing Financial Alliance) with a specialization in holistic investment planning and estate management. He excels in assisting clients to grow their investment capital and establish passive income streams for retirement. Kenny also facilitates tax-efficient portfolio transfers to beneficiaries, ensuring tax-efficient capital appreciation through risk mitigation approaches and optimized wealth transfer through strategic asset structuring.
In addition to his advisory role, Kenny is an esteemed SGX Academy trainer specializing in S-REIT investing and regularly shares his insights on MoneyFM 89.3. He holds the titles of Certified Estate & Legacy Planning Consultant and CERTIFIED FINANCIAL PLANNER (CFP).
With over a decade of experience in holistic estate planning, Kenny employs a unique “3-in-1 Will, LPA, and Standby Trust” solution to address clients’ social considerations, legal obligations, emotional needs, and family harmony. He holds double master’s degrees in Business Administration and Electrical Engineering, and is an Associate Estate Planning Practitioner (AEPP), a designation jointly awarded by The Society of Will Writers & Estate Planning Practitioners (SWWEPP) of the United Kingdom and Estate Planning Practitioner Limited (EPPL), the accreditation body for Asia.
Arrange for a non-obligatory one-to-one free consultation here!
Taking the first step toward estate planning is one of the most selfless acts of love you can perform for your family. It ensures your hard-earned assets are protected, your wishes are respected, and your loved ones are spared from administrative chaos and family disputes during an already painful time.
However, entering the world of estate planning can feel like trying to learn a foreign language. What is a “Donee”? Who needs a “Protector”? And what on earth does an “Estate Planner” actually do?
This educational guide breaks down the key appointments, roles, and critical considerations you need to know to secure your family’s future.
1. The Conductor: The Estate Planner
Before diving into the legal documents, you need an architect. Many people make the mistake of rushing to draft a Will without looking at the bigger picture. This is where an Estate Planner comes in.
The Role: An Estate Planner is a professional who evaluates your entire financial and personal situation (assets, liabilities, insurance, family dynamics) to create a holistic legacy blueprint.
What They Do: They facilitate tough family conversations, identify potential legal or tax vulnerabilities, and coordinate with lawyers and trust companies to ensure your plan is airtight.
Key Consideration: Choose a qualified planner who looks at your estate holistically, rather than someone simply trying to sell a one-off financial product.
2. The Will: Managing Your Estate After Death
A Will is a legal document that dictates how your assets will be distributed and who will look after your minor children after you pass away. Without one, the state decides who gets what based on default laws.
Key Appointments to Know:
Testator: This is you—the person making the Will and owning the assets.
Executor: The person (or professional institution) you appoint to carry out the instructions in your Will. They locate your assets, pay off your debts, and distribute the remainder to your loved ones.
Beneficiary: The individuals, family members, or charities chosen to receive your assets.
Guardian: The person appointed to take legal custody of your children if they are minors when you pass away.
Witness: Two independent individuals who must watch you sign the Will to make it legally valid.
Key Considerations:
Choosing an Executor: This is a heavy administrative burden involving legal processes (probate). Choose someone who is highly organized, financially literate, and trustworthy. Always name a backup Executor.
Choosing a Guardian: Ensure your chosen guardian shares similar parenting values and lifestyle choices. Most importantly, ask them for permission before naming them in your Will.
3. The Lasting Power of Attorney (LPA): Protecting Your Lifetime Welfare
While a Will handles things after you die, an LPA protects you while you are alive but mentally incapacitated (e.g., due to advanced dementia, a severe stroke, or a coma).
Key Appointments to Know:
Donor: This is you—the person giving away the decision-making power.
Donee: The trusted person (or persons) you appoint to step into your shoes and make decisions on your behalf. Donees can manage two main areas:
Personal Welfare: Making medical decisions, choosing nursing homes, and managing daily care.
Property & Affairs: Managing your bank accounts, paying your bills, or selling your property to fund your medical needs.
Replacement Donee: A backup person who steps in only if your primary Donee passes away or loses mental capacity themselves.
Key Considerations:
You can appoint multiple Donees to act “jointly” (they must agree unanimously on everything) or “jointly and severally” (they can make decisions independently). For urgent medical situations, “jointly and severally” is often preferred to prevent delays.
4. The Trust: Long-Term Control and Asset Protection
A Trust is a legal arrangement where you transfer assets to a third party to hold and manage for the benefit of your loved ones. It is highly effective for protecting spendthrift heirs, minor children, or preserving wealth across generations.
Key Appointments to Know:
Settlor: This is you—the creator of the trust who funds it with assets.
Trustee: The legal owner and manager of the trust assets. They must manage and distribute the funds strictly according to your “Letter of Wishes.”
Beneficiary: The people who receive the financial benefits of the trust (e.g., receiving a monthly allowance for education or living expenses).
Protector: An optional, independent “watchdog” who monitors the Trustee. They can be given the power to fire the Trustee or veto certain decisions to ensure your original intentions are honored.
Investment Advisor: A financial professional appointed to manage the trust’s investment portfolio, ensuring the wealth grows over time.
Key Considerations:
If you have complex assets or major wealth to protect, appointing a Professional Trust Company as your Trustee is often safer than appointing a family member. It removes emotional bias and ensures professional competency.
5. Other Crucial Figures: Nominees
Nominee: In many jurisdictions, assets like life insurance policies and government retirement accounts (such as CPF in Singapore or 401ks/IRAs in the US) cannot be distributed via a Will. You must explicitly name a Nominee directly with the respective institution to ensure the money goes to the right person.
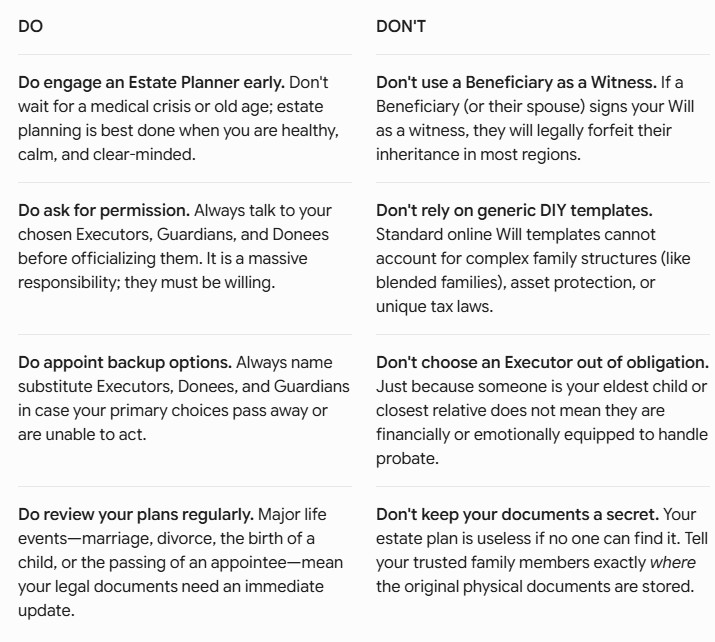
Summary: The Ultimate Legacy “Do’s and Don’ts”
To kickstart your estate planning journey successfully, keep this essential checklist in mind:
Final Thoughts
Estate planning isn’t just for the ultra-wealthy—it is for anyone who wants to protect their family from unnecessary heartache, financial strain, and legal battles. Now that you know who the key players are, reach out to a professional Estate Planner to start drafting your family’s safety net today.
Kenny Loh is a distinguished Wealth Advisory Director (RNF# LKK300389588 Representing Financial Alliance) with a specialization in holistic investment planning and estate management. He excels in assisting clients to grow their investment capital and establish passive income streams for retirement. Kenny also facilitates tax-efficient portfolio transfers to beneficiaries, ensuring tax-efficient capital appreciation through risk mitigation approaches and optimized wealth transfer through strategic asset structuring.
In addition to his advisory role, Kenny is an esteemed SGX Academy trainer specializing in S-REIT investing and regularly shares his insights on MoneyFM 89.3. He holds the titles of Certified Estate & Legacy Planning Consultant and CERTIFIED FINANCIAL PLANNER (CFP).
With over a decade of experience in holistic estate planning, Kenny employs a unique “3-in-1 Will, LPA, and Standby Trust” solution to address clients’ social considerations, legal obligations, emotional needs, and family harmony. He holds double master’s degrees in Business Administration and Electrical Engineering, and is an Associate Estate Planning Practitioner (AEPP), a designation jointly awarded by The Society of Will Writers & Estate Planning Practitioners (SWWEPP) of the United Kingdom and Estate Planning Practitioner Limited (EPPL), the accreditation body for Asia.
Arrange for a non-obligatory one-to-one free consultation here!