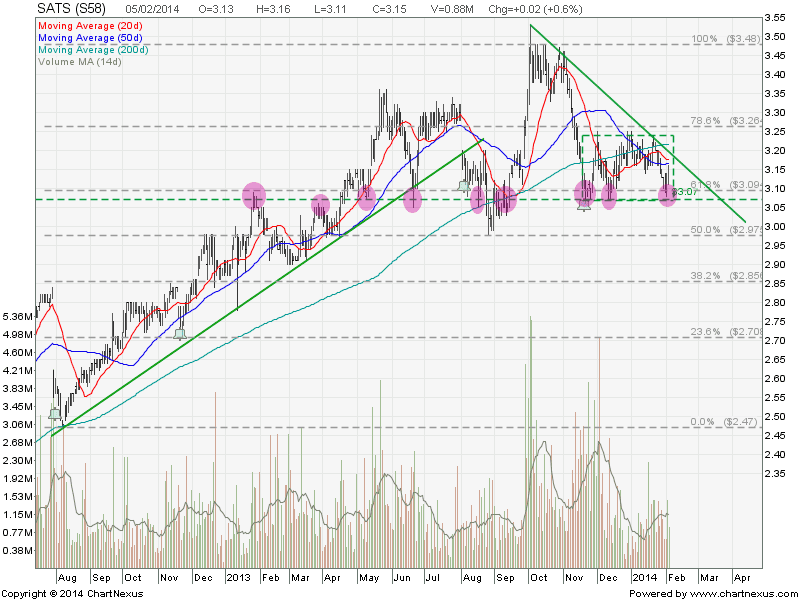
SATS is holding well during the January 2014 worldwide sell off. The key question is: How Long can SATS continue to hold and avoid being sold off?
Base on the chart, SATS is currently trading in a Rectangle and also the Descending Triangle with a crucial resistance turned support zone between $3.07 and $3.10. This support zone coincides with the 61.8% Fibonacci Retracement Level. Upside is very limited as there are many resistances (20D, 50D, 200D SMA), Rectangles resistance and the Descending Triangle resistance from $3.16 to $3.24.
Original post by Marubozu from My Stocks Investing Journey.
Fundamental Data for SATS
| Current P/E Ratio (ttm) |
18.7500 |
| Estimated P/E(03/2014) |
16.7553 |
| Relative P/E vs. FSSTI |
1.4917 |
| Earnings Per Share (SGD) (ttm) |
0.1680 |
| Est. EPS (SGD) (03/2014) |
0.1880 |
| Est. PEG Ratio |
1.7656 |
| Market Cap (M SGD) |
3,532.90 |
| Shares Outstanding (M) |
1,121.56 |
| 30 Day Average Volume |
916,733 |
| Price/Book (mrq) |
2.5450 |
| Price/Sale (ttm) |
1.9475 |
| Dividend Indicated Gross Yield |
3.49% |
| Cash Dividend (SGD) |
0.0500 |
| Dividend Ex-Date |
11/19/2013 |
| 5 Year Dividend Growth |
1.39% |
| Next Earnings Announcement |
02/11/2014 |
..
VALUATION RATIOS
|
Company |
Industry |
Sector |
| P/E Ratio (TTM) |
17.31 |
19.48 |
1,065.88 |
| P/E High – Last 5 Yrs. |
16.87 |
104.42 |
43.28 |
| P/E Low – Last 5 Yrs. |
8.90 |
30.42 |
10.59 |
Summary
Fundamentally SATS is not cheap base on PE Ratio as current PE (TTM) is at the high end of PE High for the last 5 years. Dividend yield at 3.49% is not very attractive as there are other blue chip stocks or REIT with more attractive dividend yield.
Technically SATS upside is capped by the down trend line and there is a danger of breaking the crucial support. It is expected more selling to come if the support is broken. Good candidate to short with price target of $2.90 (Rectangle) and $2.70 (Descending Triangle).