Defensive Sectors in Play. Warning Sign Ahead?
Very interesting observation that XLU (Utilities) & XLV (Healthcare) are out performing the S&P500 since the start of 2014. Utilities and Healthcare are the defensive in nature.
Investopedia explains ‘Defensive Stock’
Defensive stocks remain stable during the various phases of the business cycle. During recessions they tend to perform better than the market; however, during an expansion phase it performs below the market. Betas of defensive stocks are less than one.
The utility industry is an example of defensive stocks because during all phases of the business cycle, people need gas and electricity. Many active investors will invest in defensive stocks if a market downturn is expected. However, if the market is expected to prosper, active investors will often choose stocks with higher betas in an attempt to maximize return.
Also known as a “non-cyclical stock” because it is not highly correlated with the business cycle.
YTD Performance for 9 Sectors

YTD Charts for 9 Sectors (Relative Performance to S&P500)


Portfolio Holding for XLU

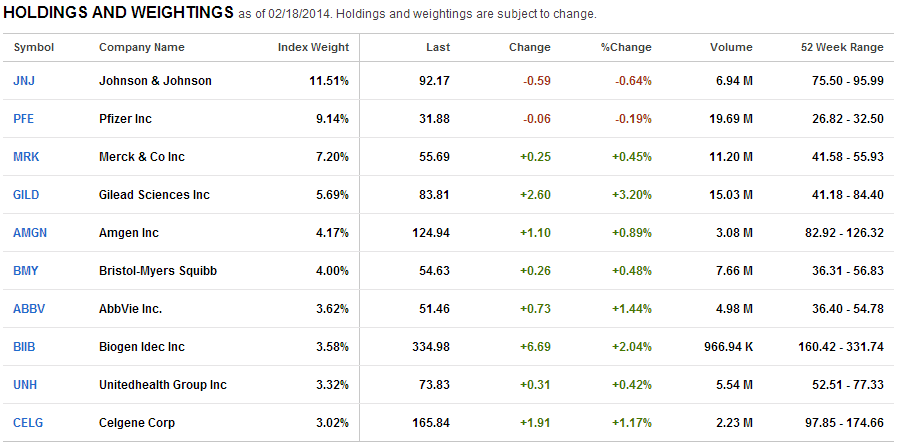
Portfolio Holding for XLV
Sector Rotation

If you know how to follow the Money Flow in the Sector Rotation, you will increase the winning probability in your stock investing & trading because most of the stocks in the sectors will be moving up together. It is not really a rocket science to understand this theory but the question is HOW to identify the money flow into a particular sector and which stocks to choose.
I will be explaining Sector Investing & ETF Investing / Trading, in the coming workshop, CLICK HERE to sign up “How to Trade in US Stock Market“.
..