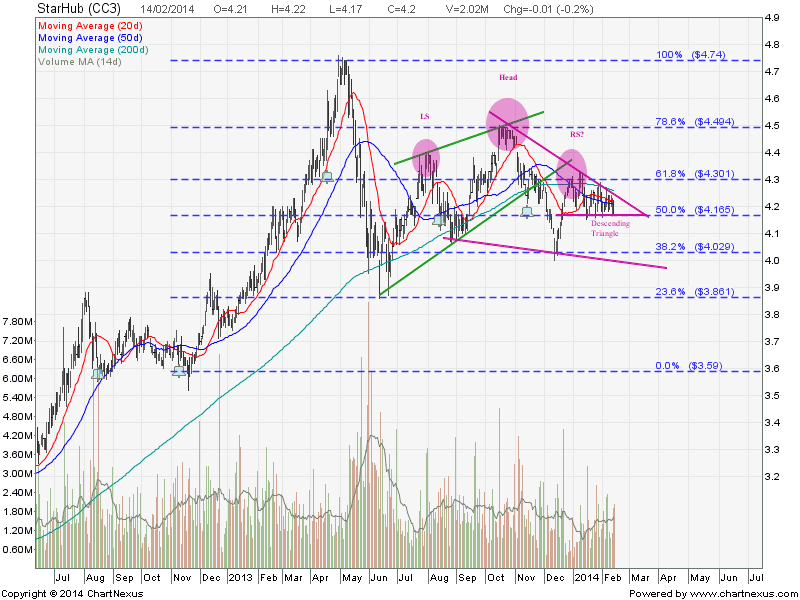
SIA Engineering : Start Down Trend!

  • Post author:

SIA Engineering broke down from a Symmetrical Triangle and start a down trend now. The stock has a breakaway gap and currently trading below all 3 moving averages. Price Target for this breakout is $4.43. Immediate support turned resistance at $4.75 followed by $4.87 (Gap resistance & 61.8% FR).

Original post by Marubozu from My Stocks Investing Journey.

SIA Engineering Aug Feb6-2014

..

Current P/E Ratio (ttm) 19.5833
Estimated P/E(03/2014) 19.2623
Relative P/E vs. FSSTI 1.5459
Earnings Per Share (SGD) (ttm) 0.2400
Est. EPS (SGD) (03/2014) 0.2440
Est. PEG Ratio 3.6830
Market Cap (M SGD) 5,240.09
Shares Outstanding (M) 1,114.91
30 Day Average Volume 210,633
Price/Book (mrq) 4.0539
Price/Sale (ttm) 4.5345
Dividend Indicated Gross Yield 4.68%
Cash Dividend (SGD) 0.0700
Dividend Ex-Date 11/18/2013
5 Year Dividend Growth 0.93%
Next Earnings Announcement 05/14/2014

..

VALUATION RATIOS

Company Industry Sector
P/E Ratio (TTM) 20.01 19.55 1,069.42
P/E High – Last 5 Yrs. 19.50 104.50 43.62
P/E Low – Last 5 Yrs. 7.77 30.55 10.65
Continue ReadingSIA Engineering : Start Down Trend!

Global Stock Market Indices PE Ratio At a Glance (5 Feb 2014)

  • Post author:

Market Indices PE Ratio for Major Stock Exchange globally.

Average PE ratio decreases from 18.76  to 19.23. The PE ratio increases amid the global stock market sell off indicates companies earning are getting poorer.

Jan 2014 Month Global PE Ratio.

  • US: Dow Jones Industrial, S&P500, NASDAQ, Russell 2000
  • Europe: FTSE100, CAC40, DAX
  • Asia: KLCI, STI, HangSeng, ASX200, CSI 300, JCI, SET, KOPSI, NIKKEI 225, SENSEX, TWSE, NZX50, PSEi

Stock Market Key Indices PE Ratio Feb5-2014


..

Shiller PE Ratio Feb5-2014


..

Continue ReadingGlobal Stock Market Indices PE Ratio At a Glance (5 Feb 2014)

SATS: Watch the Crucial Support

  • Post author:

SATS  is holding well during the January 2014 worldwide sell off. The key question is: How Long can SATS continue to hold and avoid being sold off?

Base on the chart, SATS is currently trading in a Rectangle and also the Descending Triangle with a crucial resistance turned support zone between $3.07 and $3.10. This support zone coincides with the 61.8% Fibonacci Retracement Level. Upside is very limited as there are many resistances (20D, 50D, 200D SMA), Rectangles resistance and the Descending Triangle resistance from $3.16 to $3.24.

2014Feb5-SATS-800x600

Original post by Marubozu from My Stocks Investing Journey.

Fundamental Data for SATS

Current P/E Ratio (ttm) 18.7500
Estimated P/E(03/2014) 16.7553
Relative P/E vs. FSSTI 1.4917
Earnings Per Share (SGD) (ttm) 0.1680
Est. EPS (SGD) (03/2014) 0.1880
Est. PEG Ratio 1.7656
Market Cap (M SGD) 3,532.90
Shares Outstanding (M) 1,121.56
30 Day Average Volume 916,733
Price/Book (mrq) 2.5450
Price/Sale (ttm) 1.9475
Dividend Indicated Gross Yield 3.49%
Cash Dividend (SGD) 0.0500
Dividend Ex-Date 11/19/2013
5 Year Dividend Growth 1.39%
Next Earnings Announcement 02/11/2014

..

VALUATION RATIOS

Company Industry Sector
P/E Ratio (TTM) 17.31 19.48 1,065.88
P/E High – Last 5 Yrs. 16.87 104.42 43.28
P/E Low – Last 5 Yrs. 8.90 30.42 10.59


Summary

Fundamentally SATS is not cheap base on PE Ratio as current PE (TTM) is at the high end of PE High for the last 5 years. Dividend yield at 3.49% is not very attractive as there are other blue chip stocks or REIT with more attractive dividend yield.

Technically SATS upside is capped by the down trend line and there is a danger of breaking the crucial support. It is expected more selling to come if the support is broken. Good candidate to short with price target of $2.90 (Rectangle) and $2.70 (Descending Triangle).

Continue ReadingSATS: Watch the Crucial Support