Fossil Group Inc (FOSL) Details
Fossil Group, Inc., together with its subsidiaries, engages in the design, development, marketing, and distribution of consumer fashion accessories worldwide. It operates in four segments: North America Wholesale, Europe Wholesale, Asia Pacific Wholesale, and Direct to Consumer. The company provides men’s and women’s watches; fashion accessories for men and women, including handbags, belts, small leather goods, jewelry, and sunglasses; and a line of soft accessories consisting of hats, gloves, and scarves. It also offers clothing, such as jeans, outerwear, fashion tops and bottoms, and tee shirts, as well as optical frames. The company offers its products under its proprietary brands, including FOSSIL, MICHELE, RELIC, SKAGEN, and ZODIAC, as well as under the licensed brands consisting of ADIDAS, ARMANI EXCHANGE, BURBERRY, DIESEL, DKNY, EMPORIO ARMANI, KARL LAGERFELD, MARC BY MARC JACOBS, and MICHAEL KORS. Fossil, Inc. markets its products through department stores, specialty retail stores, specialty watch and jewelry stores, retail and outlet stores, mass market stores, and clothing stores, as well as through its catalogs and Website. As of December 29, 2012, it owned and operated 131 retail stores and 95 outlet stores located in the United States, as well as 185 retail stores and 62 outlet stores internationally. The company was formerly known as Fossil, Inc. and changed its name to Fossil Group, Inc. in May 2013. Fossil Group, Inc. was founded in 1984 and is headquartered in Richardson, Texas.
Chart Pattern:
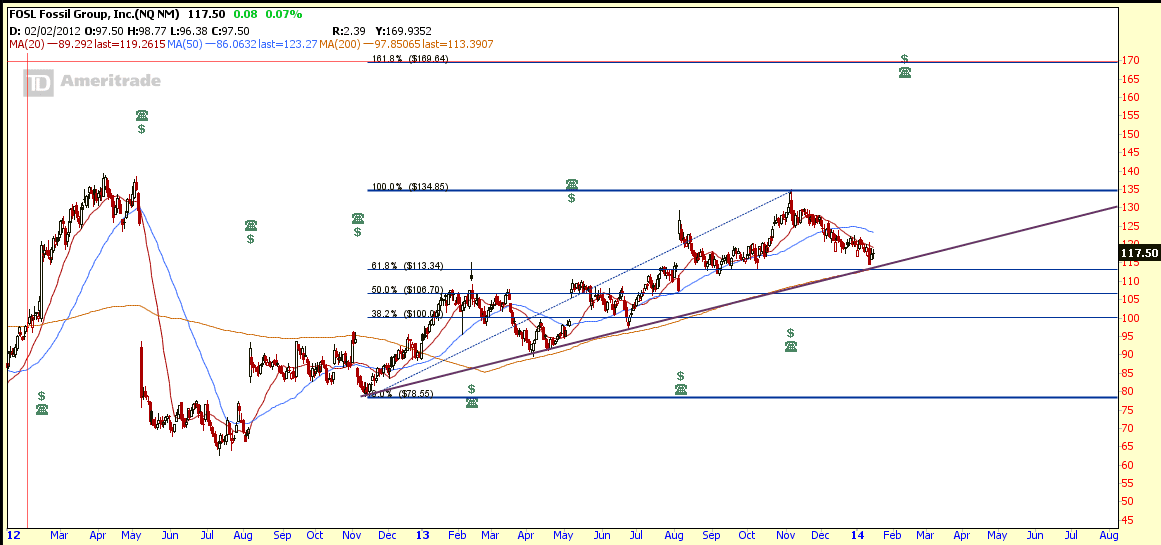
FOSL retraced back to 61.8% Fibonacci Retracement Level and rebound from the up trend support at about $113. This uptrend support line coincides with 200D SMA which is trending up. Technically the chart is bullish.
FOSL Implied Volatility

FOSL Fundamental

Option Trading Strategy:
1st Phase: Short Put Spread (Bullish Setup) at about $115 – $117
- STO FOSL Mar 14 115 Put
- BTO FOSL Mar 14 110 Put
2nd Phase: to open Short Call Spread to make it Iron Condor 110/115/135/140 to sell Vega (Volatility) before Earning Date: Feb 11 AMC if FOSL still stays between $115 & $135.
- STO FOSL Mar 14 135 Call
- BTO FOSL Mar 14 140 Call
Exit Plan:
Expect IV to drop drastically after earning and close the Iron Condor after the IV drops.
Original post by Marubozu @ My Stocks Investing Journey.


