Jardine C&C: Trend Reversal Coming Soon?
Jardine C&C is forming a Descending Triangle with a strong support at $34.00. Jardine C&C may stop the down trend if the Triangle resistance is broken. Watch the support and resistance closely for any trading opportunities.

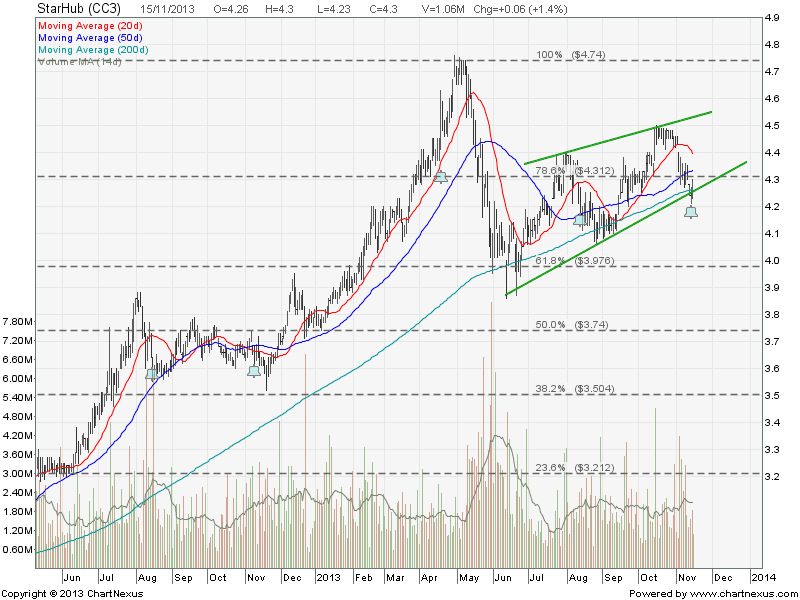
Original post by Marubozu @ My Stocks Investing Journey.
Key Statistics for JCNC
| Current P/E Ratio (ttm) | 12.0406 |
|---|---|
| Estimated P/E(12/2013) | 10.7911 |
| Relative P/E vs. FSSTI | 0.8800 |
| Earnings Per Share (USD) (ttm) | 2.3257 |
| Est. EPS (USD) (12/2013) | 2.5950 |
| Est. PEG Ratio | 2.8398 |
| Market Cap (M SGD) | 12,414.37 |
| Shares Outstanding (M) | 355.71 |
| 30 Day Average Volume | 206,933 |
| Price/Book (mrq) | 2.3836 |
| Price/Sale (ttm) | 0.4974 |
| Dividend Indicated Gross Yield | 4.39% |
| Cash Dividend (USD) | 0.1800 |
| Dividend Ex-Date | 08/27/2013 |
| 5 Year Dividend Growth | 19.21% |
| Next Earnings Announcement | 02/28/2014 |